New data from the ONS on their analysis of mortality and A&E waits has enabled new, better calculations on the magnitude of excess deaths related to long waits in A&Es in England. The results are unambiguously apocalyptic and suggest that long waits in A&Es now account for close to 1 in 10 of all annual deaths. In a rational world this would make fixing A&E waits the top NHS priority for improvement in the NHS.
In January the ONS published some new analysis of the relationship between long A&E waits and mortality. I explained their analysis here.
But they left out some important parts of the data that would enable more reliable estimates of the total number of excess deaths. Extra data released by the ONS now allows those calculations to be done.
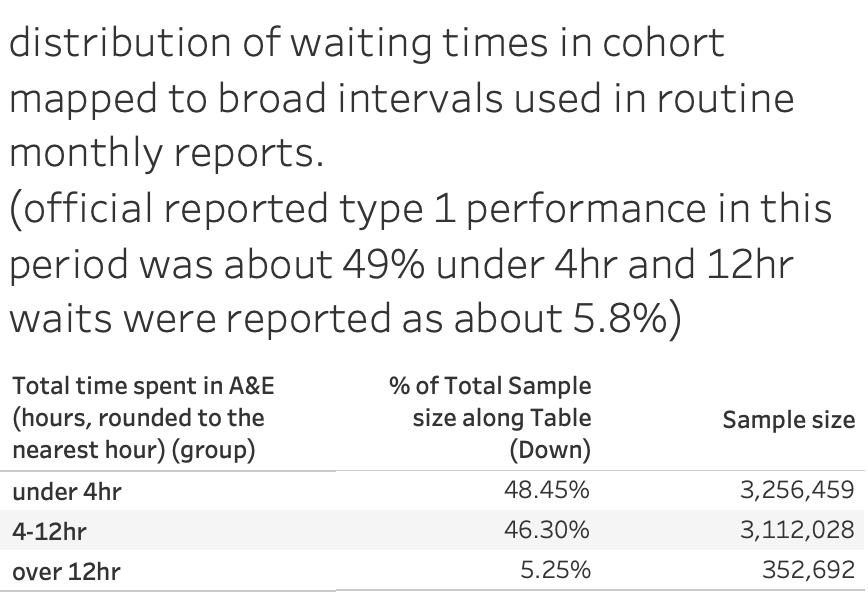
By excess deaths I mean something specific: the number of deaths that would not have happened if A&E waits were mostly below 4hr as they once were. In 2010 the NHS had fewer than 2% of patients waiting more than 4hr, so we should have some confidence this could be achieved again. Now, more than 10% of patients wait more than 12hr and it does not seem to be a big priority for action.
The new ONS data allows reliable estimates of the human cost of failing to tackle long waits. And we can estimate the the total deaths which is far more impactful and resonant than an abstract, hard to interpret and potentially misleading mortality rate.
I’m going to walk through some of their analysis to justify the claim that long A&E waits are one of the biggest causes of avoidable deaths in England.
Why mortality rates are not enough
The first release of the ONS data included the total number of patients with different waiting times. It showed analysis of the mortality rates and relative mortality rates for a variety of different subgroups of patients (discharge status, presenting condition, age and more). But, while the rates alone send a clear message that longer waits are bad, they can’t tell us how significant the bad is because they didn’t publish the size of the different subgroups. This prevents a good analysis of the number of patients suffering higher mortality and, therefore, the number of excess deaths. For example, if patients with eye conditions are 100 times more likely to die when waiting 12hr than they are at 4hr that sounds bad. But if mortality at 4hr is very low and only a small number of patients have eye conditions, the number of excess deaths might be trivial.
The extra information now published shows the number of patients in each subgroup making further analyses far more useful. A good example of why this matters is given in one of the simpler tables in the released data. This table breaks down the mix of discharged and admitted patients waiting for different times.
A simple version is shown below:

The ONS tables include the total number of admitted and discharged patients for each waiting time (they show time bands from 0hr to over 40hr but I have grouped these for simplicity into all waits less than 4hr and over 12hr).
The important observation is that the mix of patients changes over time. Only 14% of the <4hr group are admitted; but 73% of the >12hr group are admitted. Importantly admitted and discharged patients have hugely different mortalities. In the under 4hr group the mortality for discharged patients is about 0.11% but admitted patients mortality is 1.86%, nearly 20 times higher. If we just averaged the mortality for waits under 4hr and ignored the admitted/discharged mix any estimate of the total mortality would be unreliable as it would ignore the changing mix of admitted and discharged patients over time.
Now we can translate the published rates into total deaths, a number far more impactful than the mortality rates and a far better way to communicate the magnitude of the problem and compare it to other causes of death.
The new ONS data shows both mortality, waiting times and the number of patients for a variety of groupings: discharge status; age bands; acuity on arrival; presenting complaint; plus some demographic variables like patient deprivation and NHS region.
What the data represents
There are many possible criticisms of analyses that can be done with this data. But many fade away when you understand what the data is.
Statistical models, for example, can often contain dodgy assumptions or badly sampled source data so their conclusions can be very controversial. This data is harder to criticise on any of those grounds.
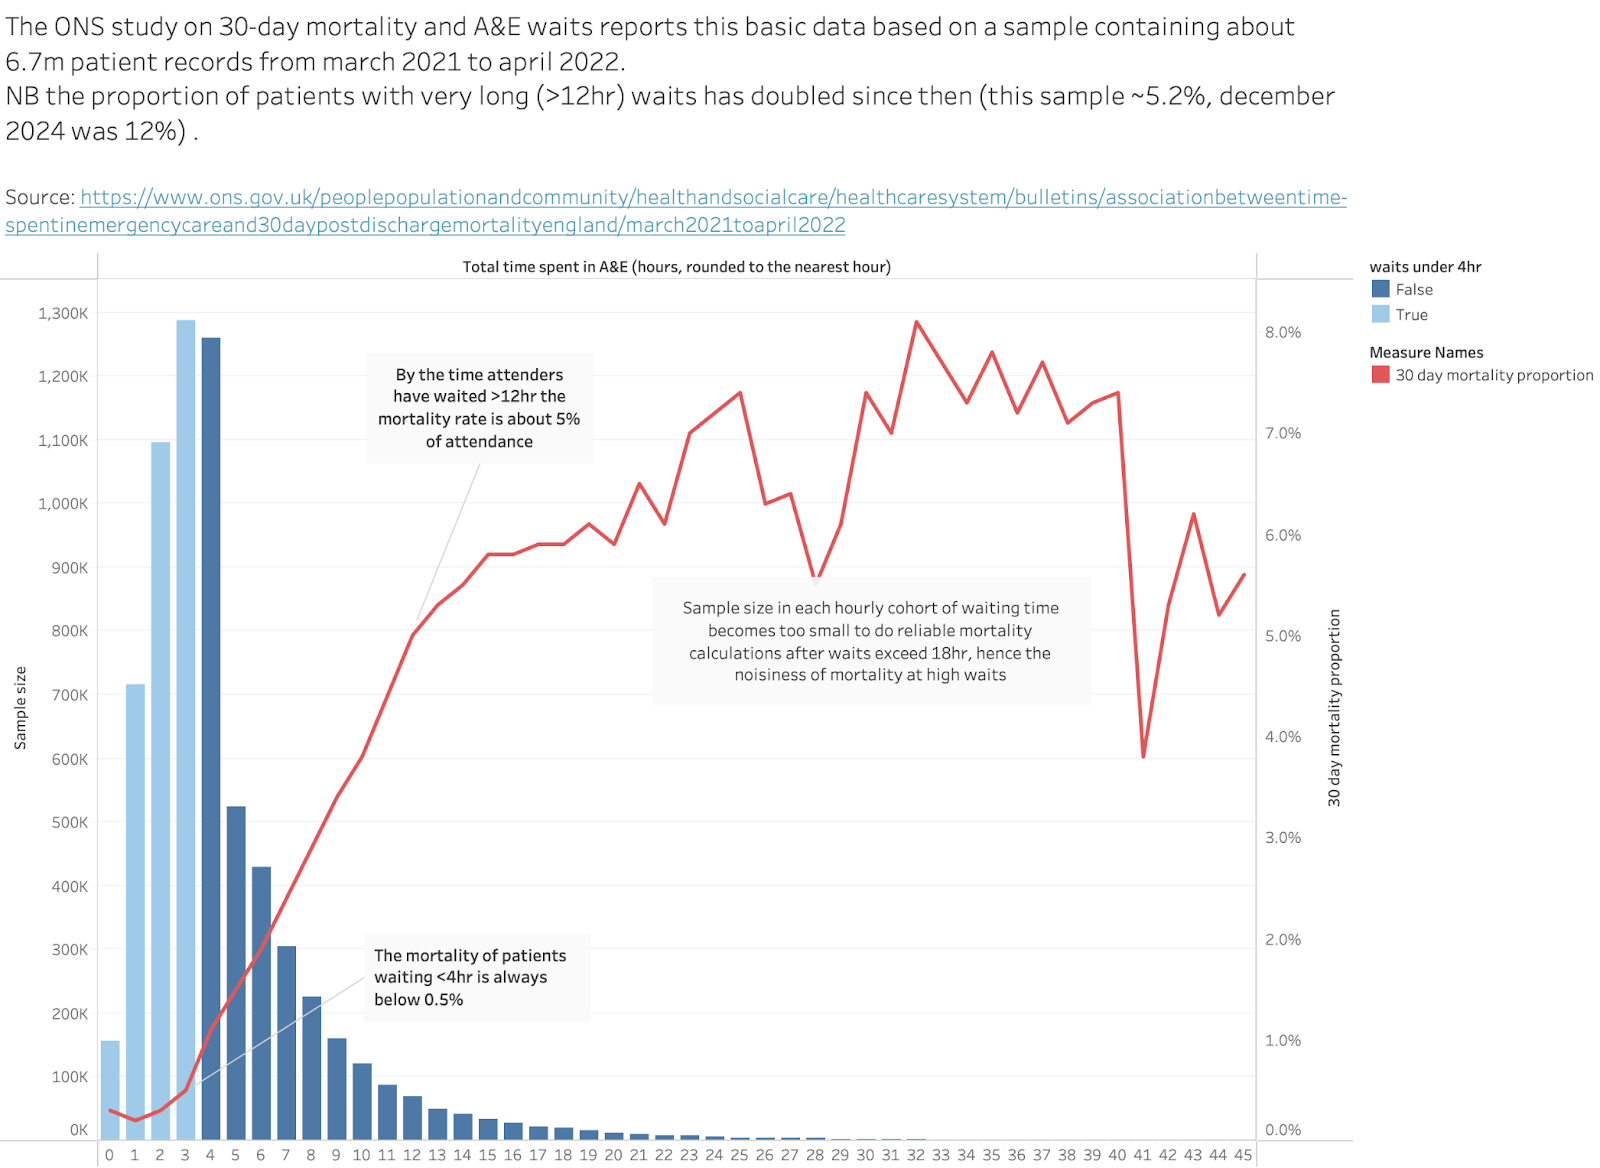
It is not a sample. It is a count of all unique patients attending english A&Es in the year to march 2022 (or, strictly speaking, it is a sample but one that includes about 95% of all patients because of data linking and missing data).
So when it reports that there were 88,657 deaths that year in 6.7m patients we don’t need large error bars on either number. They are reporting actual counts of deaths.
And when I reported above that the mortality for patients waiting below 4hr was 0.11% if they were discharged, that is a reliable fact not speculation. This distinction is worth bearing in mind for most of the results below.
It is also worth providing some context for the numbers based on other mortality data.
There were just over 540k deaths in England in 2022.
The top 6 assigned causes of death were:
These numbers are worth bearing in mind for the analyses below. Though waiting in A&E is not a specific cause itemised separately in ONS death statistics–those deaths will be classified as caused by disease groups as in the table–the number of deaths caused by excessive waiting times should be considered in the context of major causes of death as they are largely avoidable and the numbers above provide some context for judging how significantly A&E performance might influence the total number of deaths.
Estimates of excess deaths caused by long waits based on admission/discharge status
Because of the huge difference in mortality between discharged and admitted patients the first improved estimate of “excess” deaths can be based on that ONS table.
It is worth clarifying what I mean by “excess” deaths. I start by assuming that long waits in A&E are avoidable. In 2010 fear than 2% of all attendances spent more than 4hr in A&E. In recent years between 40 and 50% wait longer. Worse, in 2010 there were, perhaps, only a few thousand 12hr waits in A&E; each of the last three years have seen more than 1.7m 12hr waits. This is not an inevitable consequence of far higher attendance (this is up only about 20% since 2010). Those of us who worked to achieve the 4hr target in the early 2000s and remember how it was done believe it is still achievable and the problem has been misguided policy not an inevitable consequence of demand.
On that assumption, we can estimate the number of deaths associated with longer waits by comparing the mortality for waits less than 4hr to longer waits. To do that calculation we need to know the mortality for different types of patient at different waiting times and the number of patients suffering those waits.
Here is a table showing the raw data and the simple steps to make that estimate of excess deaths:
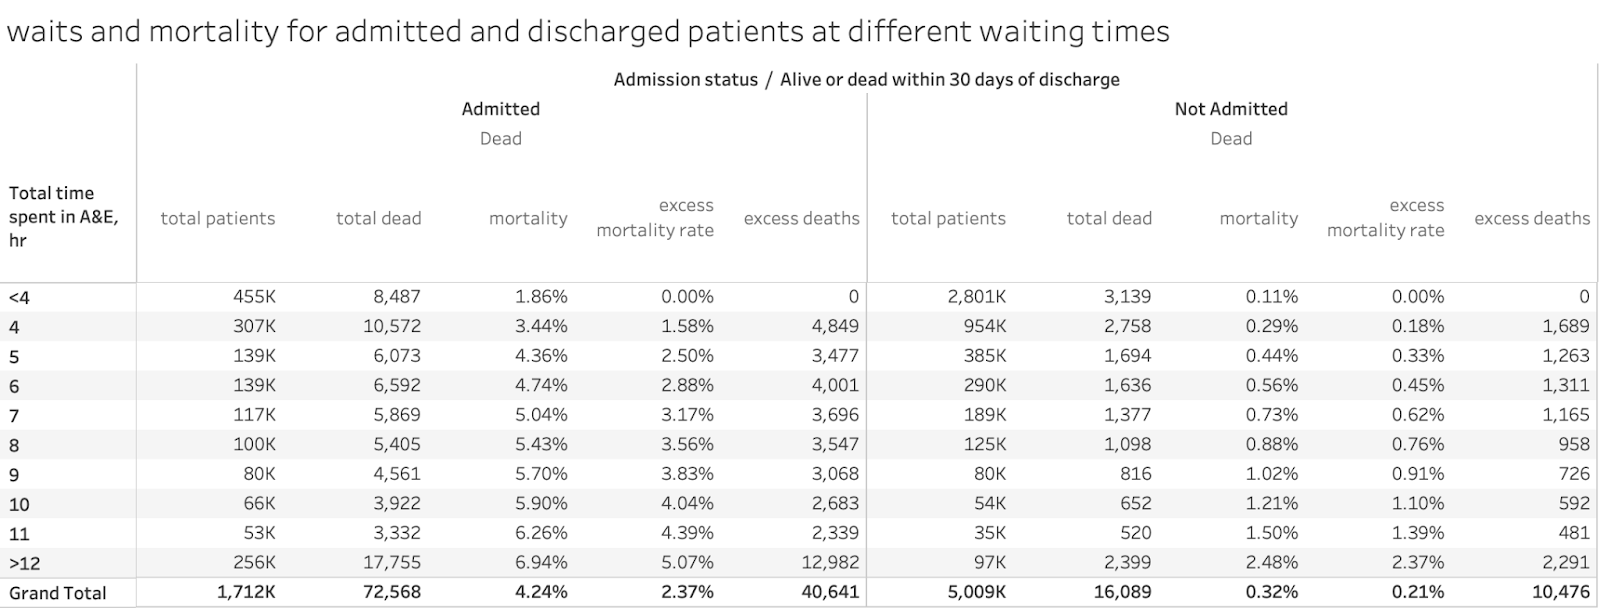
The first three columns are facts from the ONS tables separating the numbers for admitted and discharged groups: total patients, total deaths and mortality rates. The other two columns show the comparison of the mortality rates in each waiting time group to the mortality rates for those waiting <4hr and calculate the implied excess deaths from the cohort size of the same waiting time and discharge status and that excess mortality rate.
There were a total of 88,657 deaths. 11,626 of those deaths occured in patients waiting <4hr; 77,031 deaths occurred in patients waiting >4hr. This isn’t an indication of excess deaths as it ignores the base mortality those longer waiting patients would have incurred had they waited <4hr. So the excess mortality rate column makes that adjustment so that the excess deaths can be counted in each group.
On this calculation 51,147 patients died who would not have died had they waited less than 4hr. This adjusts for the changing mix of admitted and discharged patients (which was impossible in the original ONS publication).
Here is what that data looks like in a chart:

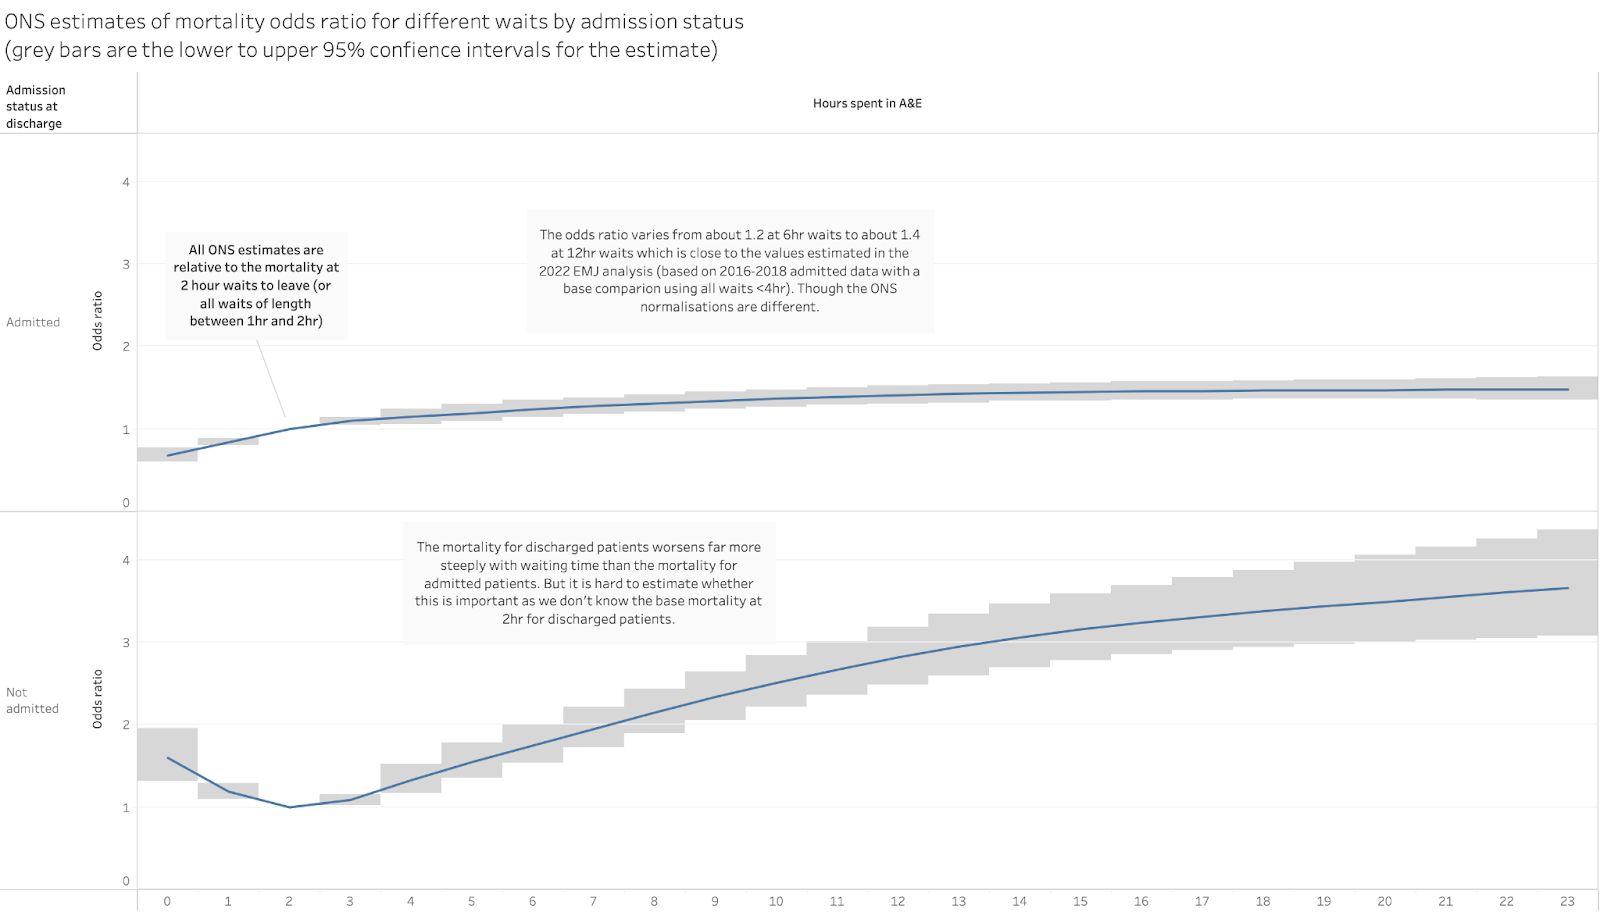
This also highlights another important feature of the extra data. While mortality for discharged patients is consistently much lower than for admitted patients (as intuition should expect), the mortality for discharged patients rises far more steeply. It is over 20 times higher at 12hr than it is at <4hr. Mortality for admitted patients starts high but is less than 4 times higher at 12hr.
It could still be argued that other factors in the changing mix of patients could account for some proportion of that excess mortality, so the wait times don’t explain it all (eg the age mix or the mix of specific conditions). More on that later. But we don’t have the details of the sophisticated ONS logistic regression model that tries to decompose the component contributions to mortality. We don’t have the cross-tabs as some analysts would say. But the waiting time is a major factor in every analysis and the changing patient mix is often an indirect consequence of the process that causes long waits so it should be reasonable to assign time in A&E as the major contributor.
So the first cut suggests that long A&E waits were the third biggest cause of avoidable deaths in England, higher than smoking and covid in 2022 with more than 50k excess deaths.
Does accounting for acuity change the picture?
Patients arriving at A&E are assessed on a 4-point acuity scale on arrival at A&E. The ONS data looks a little like this:
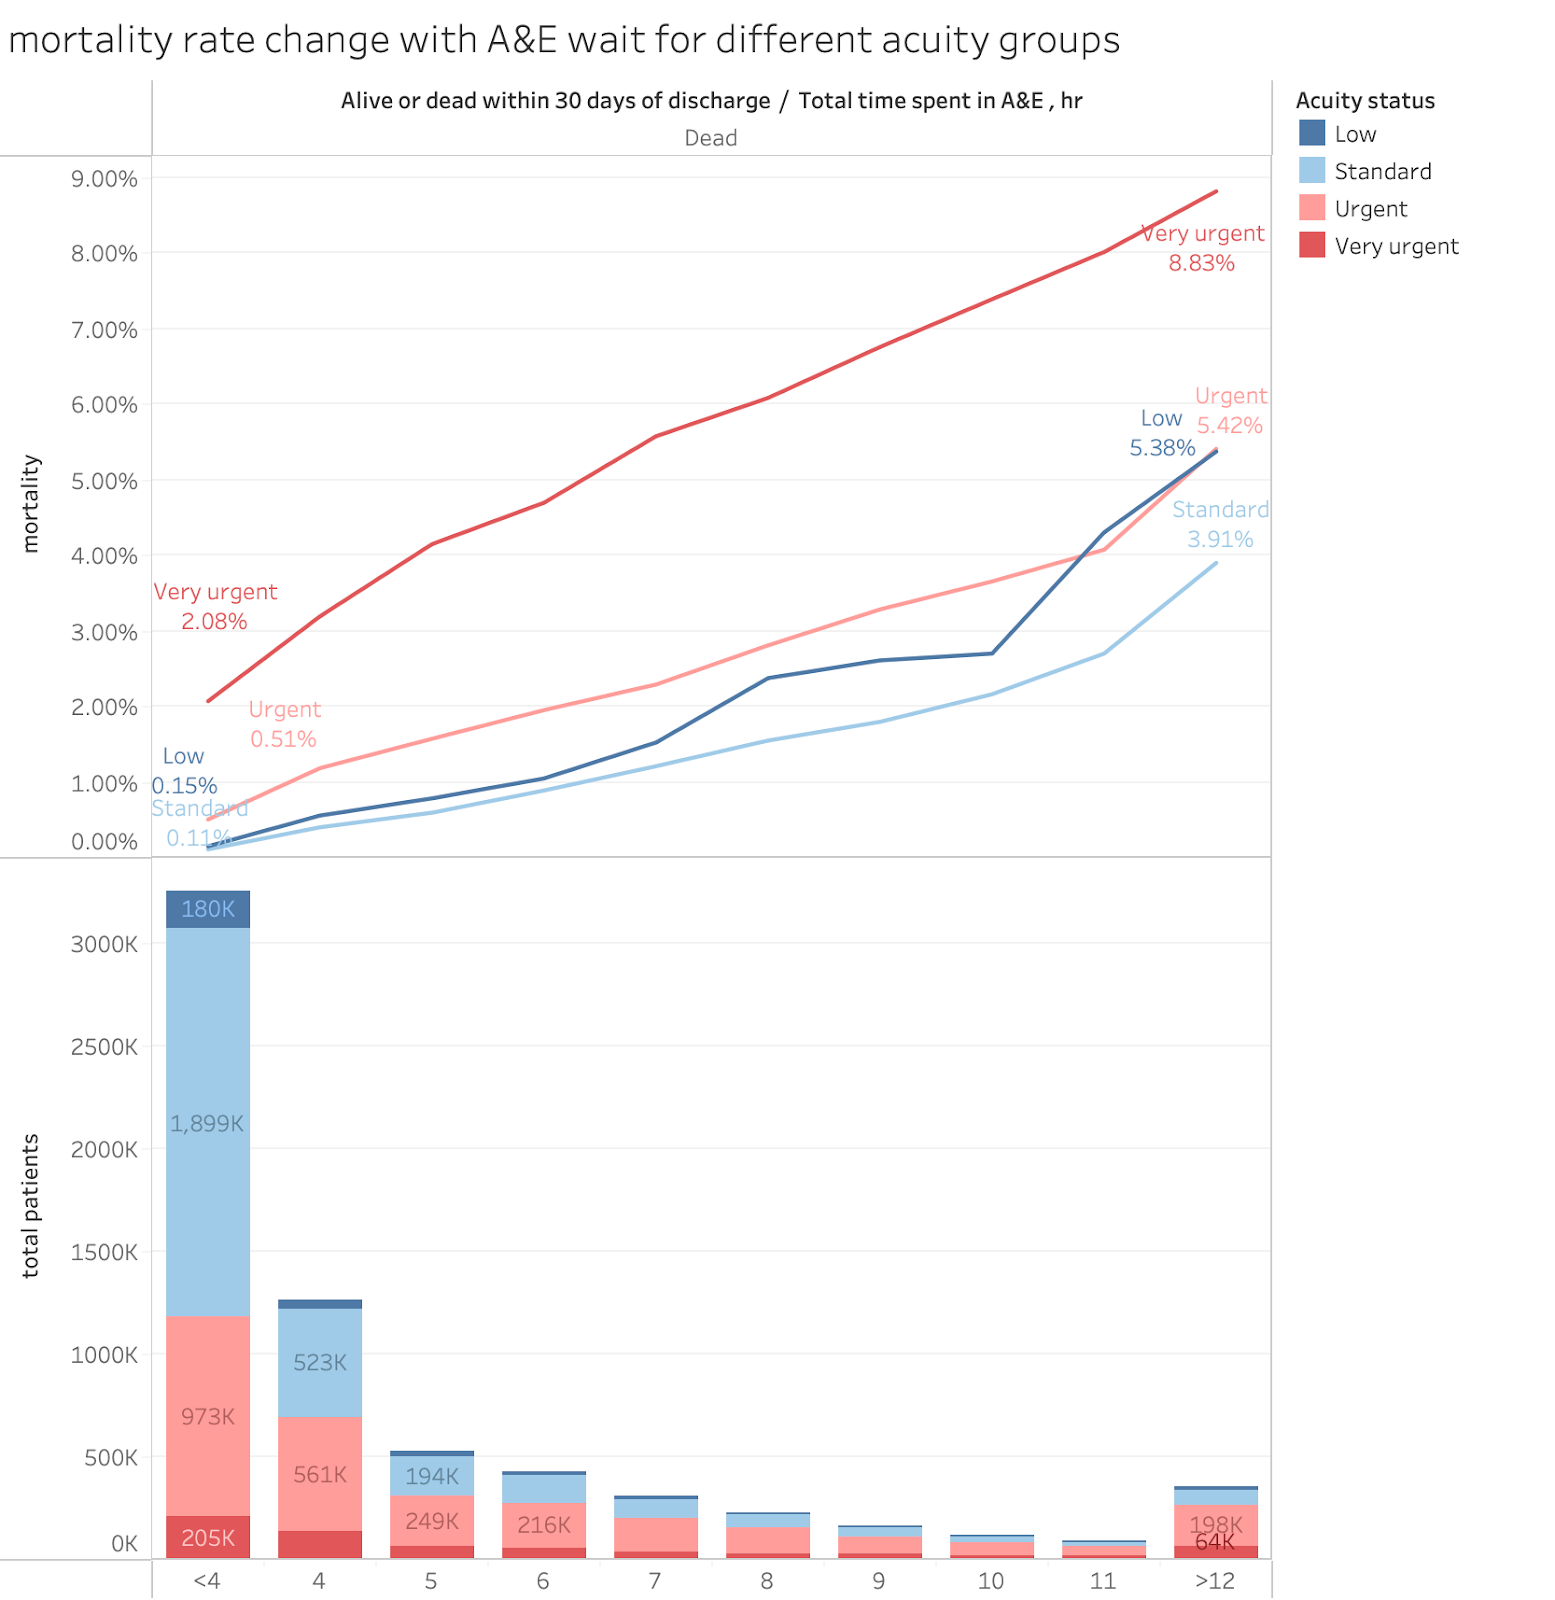
NB the lines are annotated with the mortality rates at <4hr and >12hr to indicate the degree of mortality increase associated with longer waits.
The raw data looks like this:
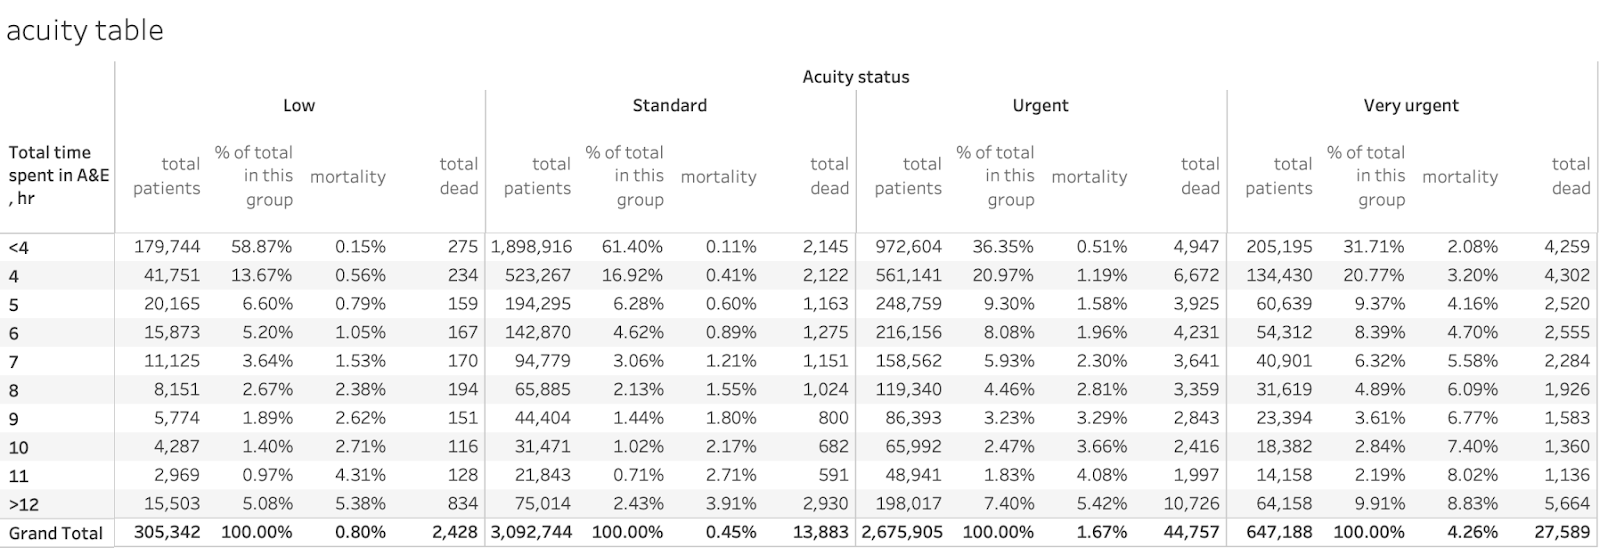
As intuition would expect, the base mortality is higher for higher acuity, with very urgent starting at just over 2% but with low and standard being just over 0.1% each. All mortality rates rise rapidly with waiting times. Less intuitively, mortality for the very urgent group is about 4 times higher for >12hr than the base level but the standard group sees a near 40-fold increase in the rate as does the low group. The relative worsening of mortality with long waits is larger for lower acuity patients than for urgent ones. This empahsises the importance of keeping waits low even for those patients who do not appear so acute on arrival.
Also the urgency with which A&Es handle each group does not match their acuity classification. About 60% of low and standard patients leave in under 4hr (see the % of total in this group column) but only 36% of the urgent and 32% of the very urgent group do. Nearly 10% of the very urgent group wait >12hr.
Applying the same simple calculation used in the admitted/discharged table will give an excess deaths estimate of about 58k, with about 18k of those accounted for by waits >12hr. As with most analyses here, the >12hr waits account for a disproportionate number of the extra deaths.
So splitting the analysis by acuity does not fundamentally change the idea that long waits kill as the excess deaths estimate is in the same ballpark as the estimate based on admission status.
What does the analysis look like by age group?
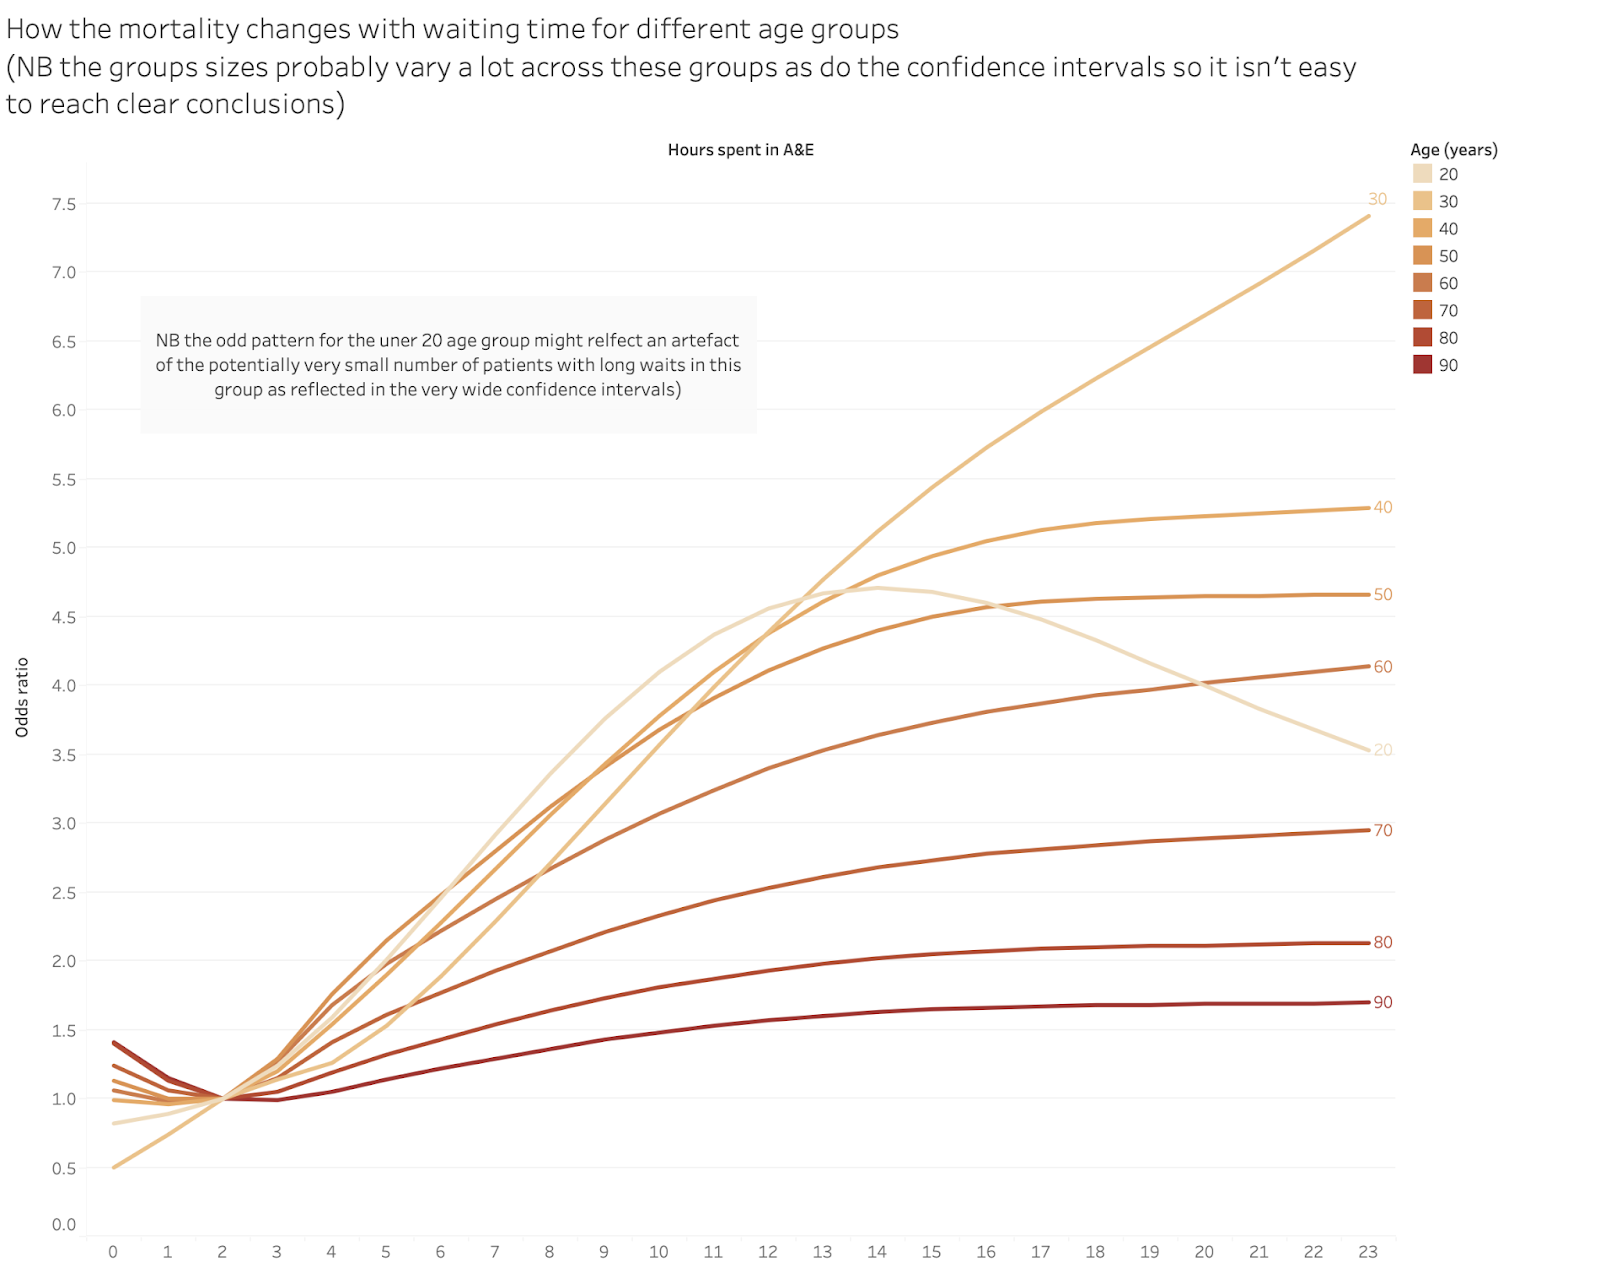
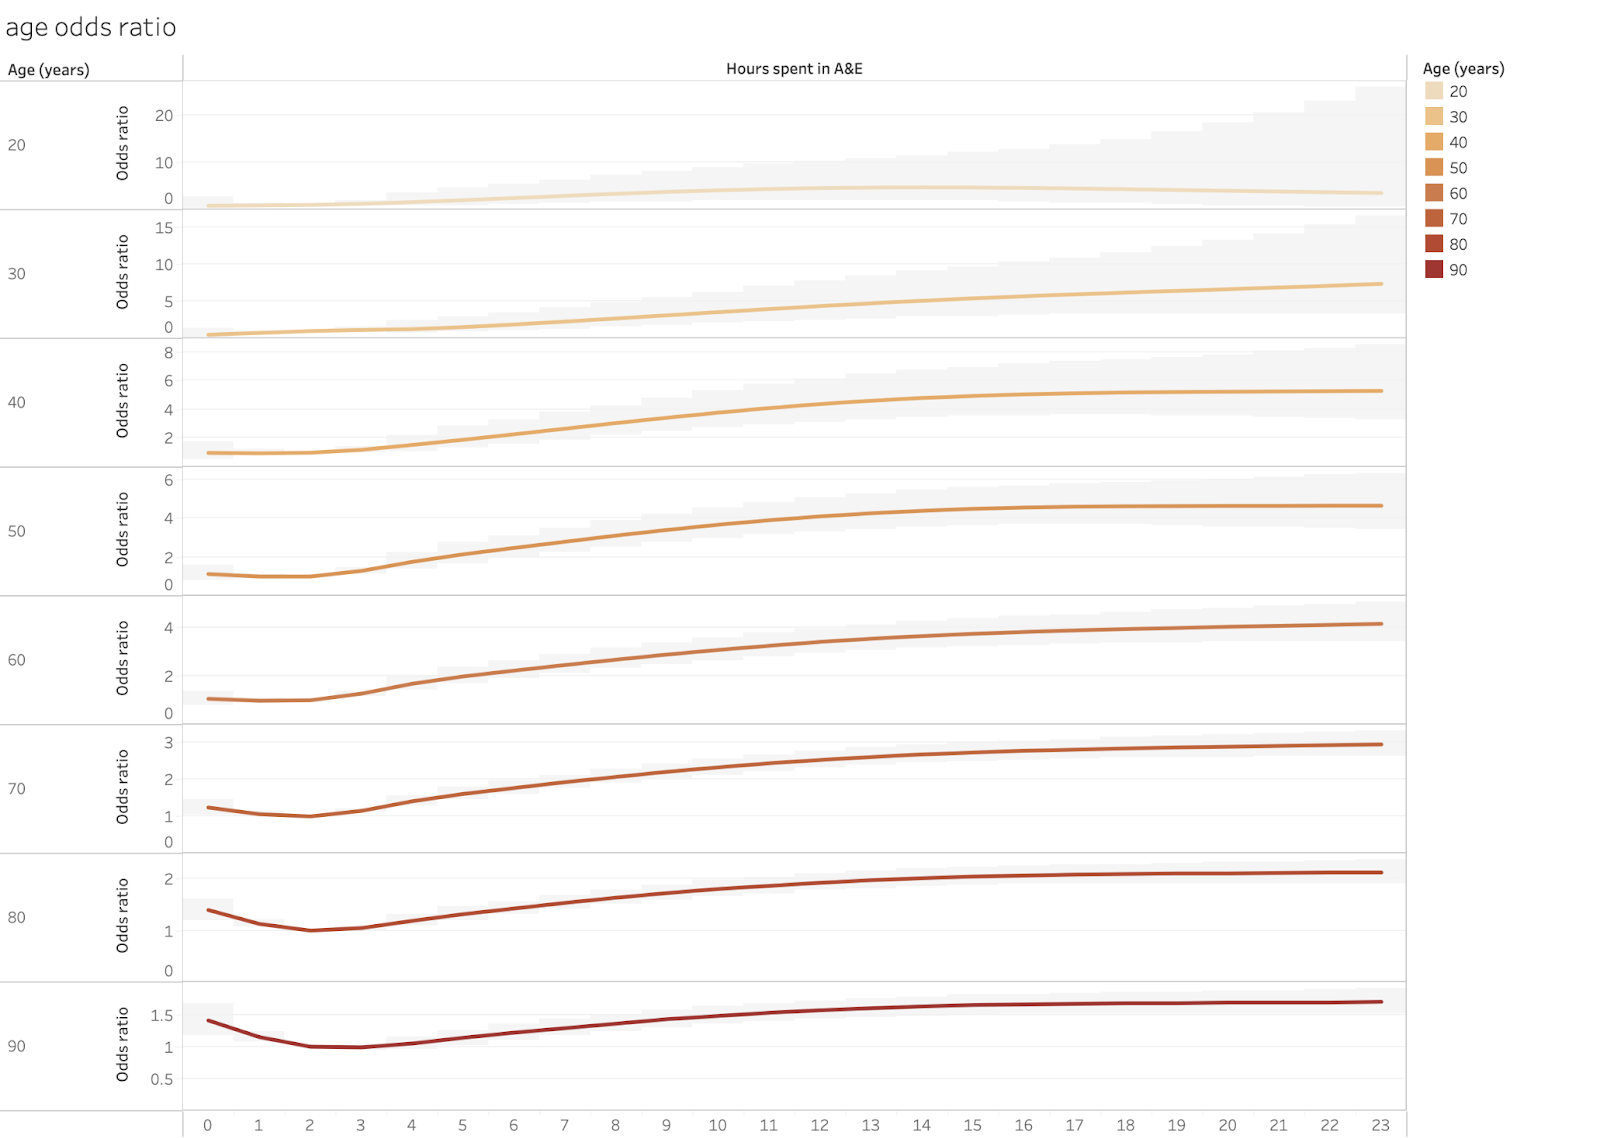
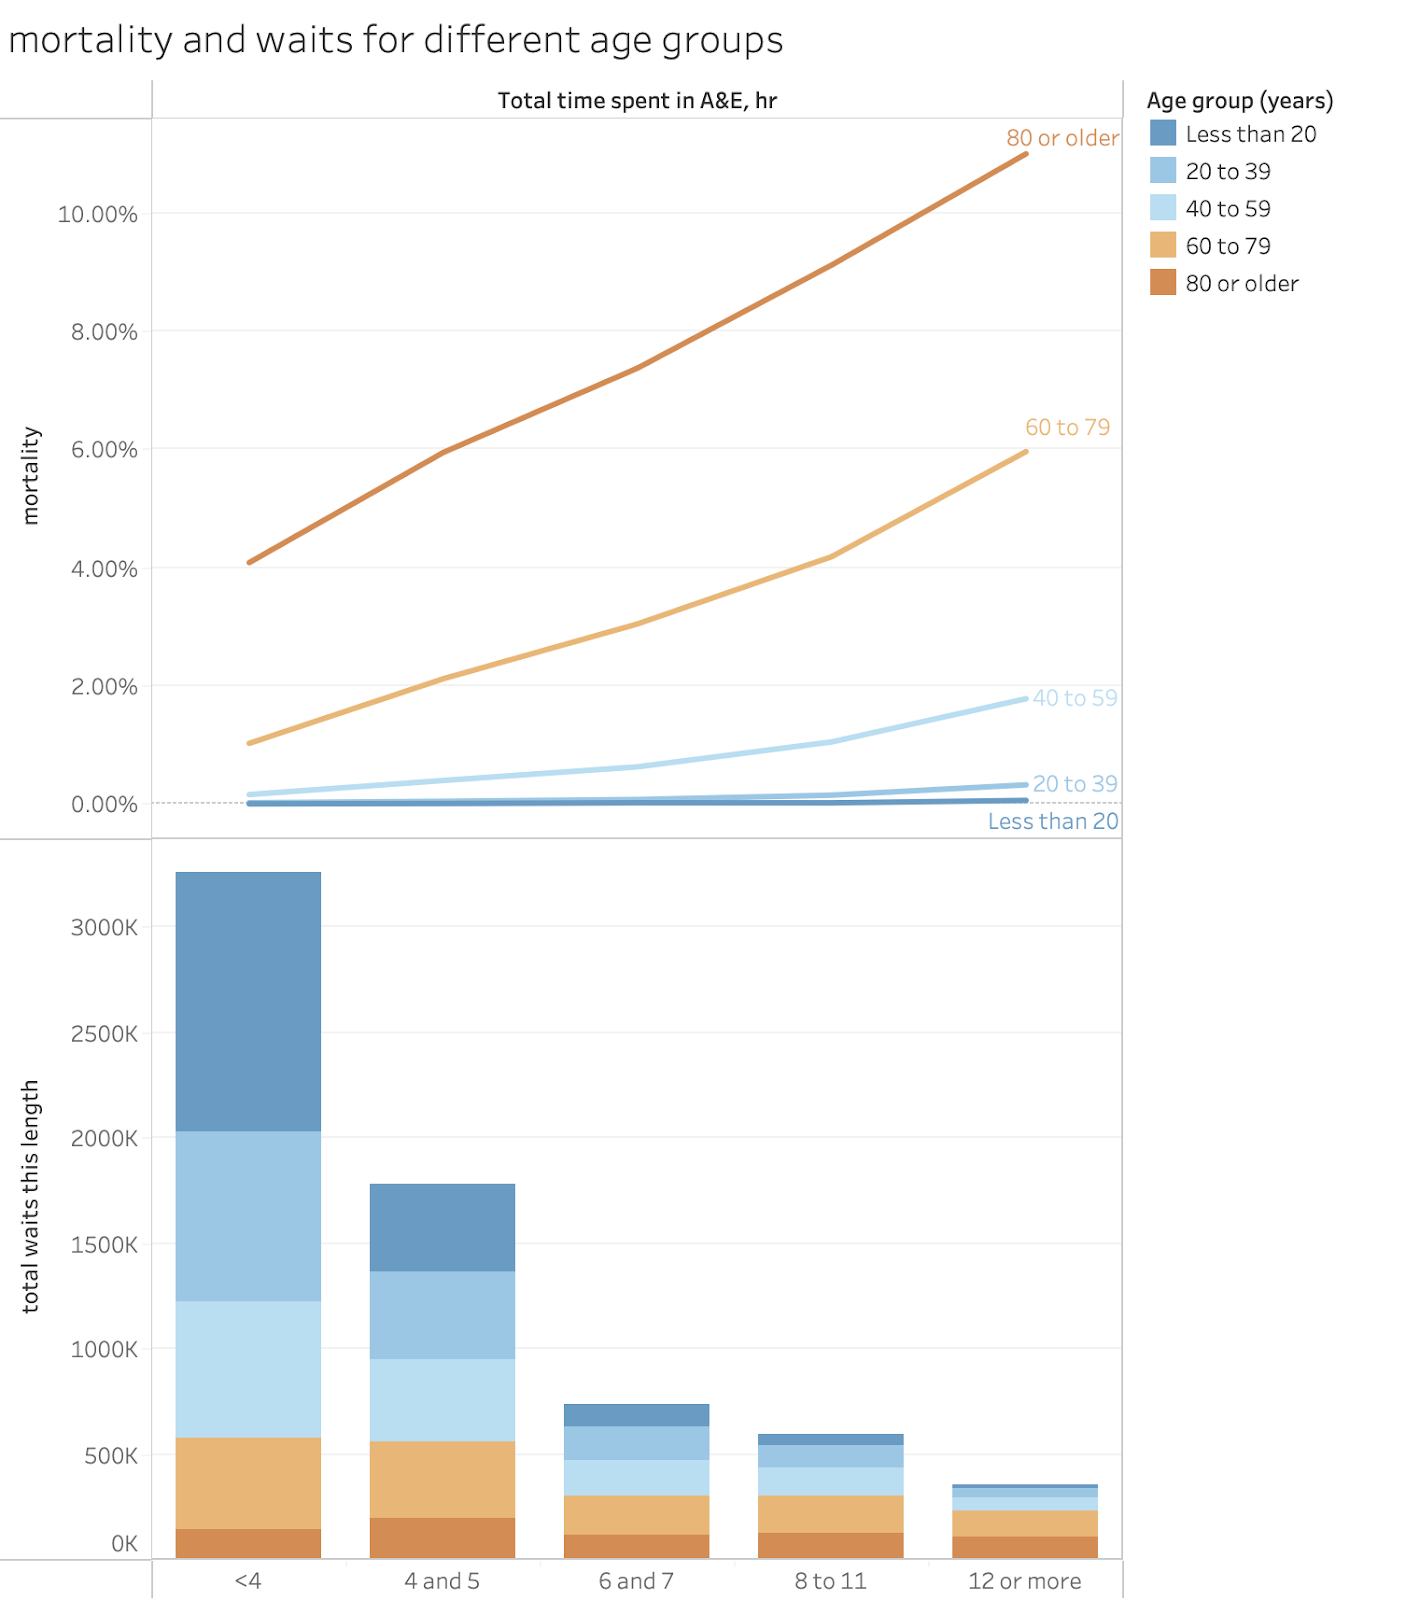
Another way to group patients is by their age. Older people are expected to have higher mortality than younger people. That analysis looks like this:
In table form:
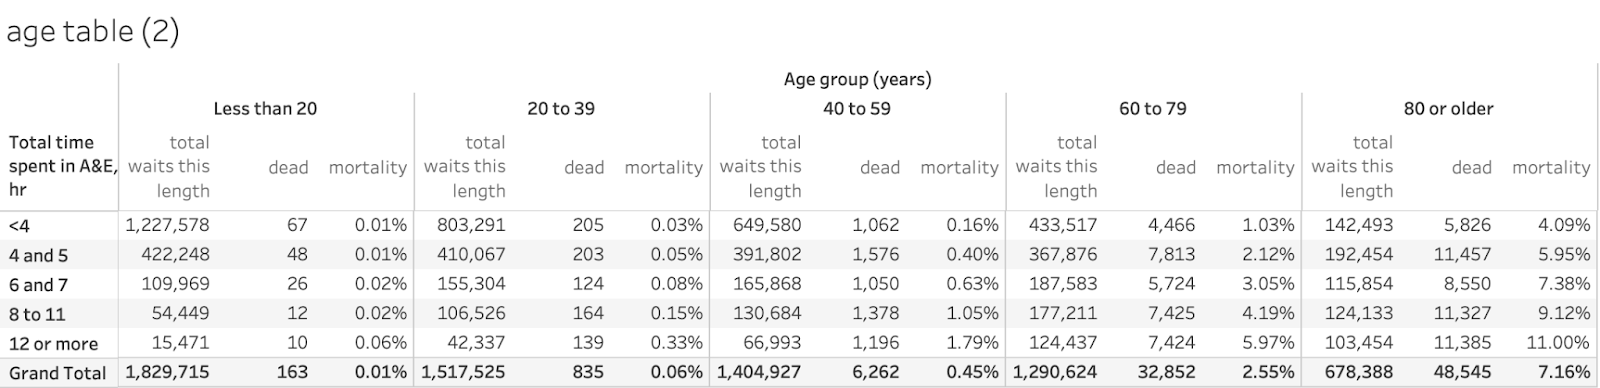
This is a cruder breakdown than some others as the ONS have used broad age groups and broad groupings of waiting times. Mortality, even with long waits, is very low for ages under 40 and those groups tend to depart A&E much faster than the older groups. Even so a quick excess deaths analysis suggests about 45k deaths caused by waits over 4hr and 15k of those occurring in the group waiting >12hr. Again, in the same ballpark as the result from other group breakdowns. Again, deaths in the group waiting >12hr account for about a third of all excess deaths, about 15k of about 45k.
What about the breakdown by presenting condition?
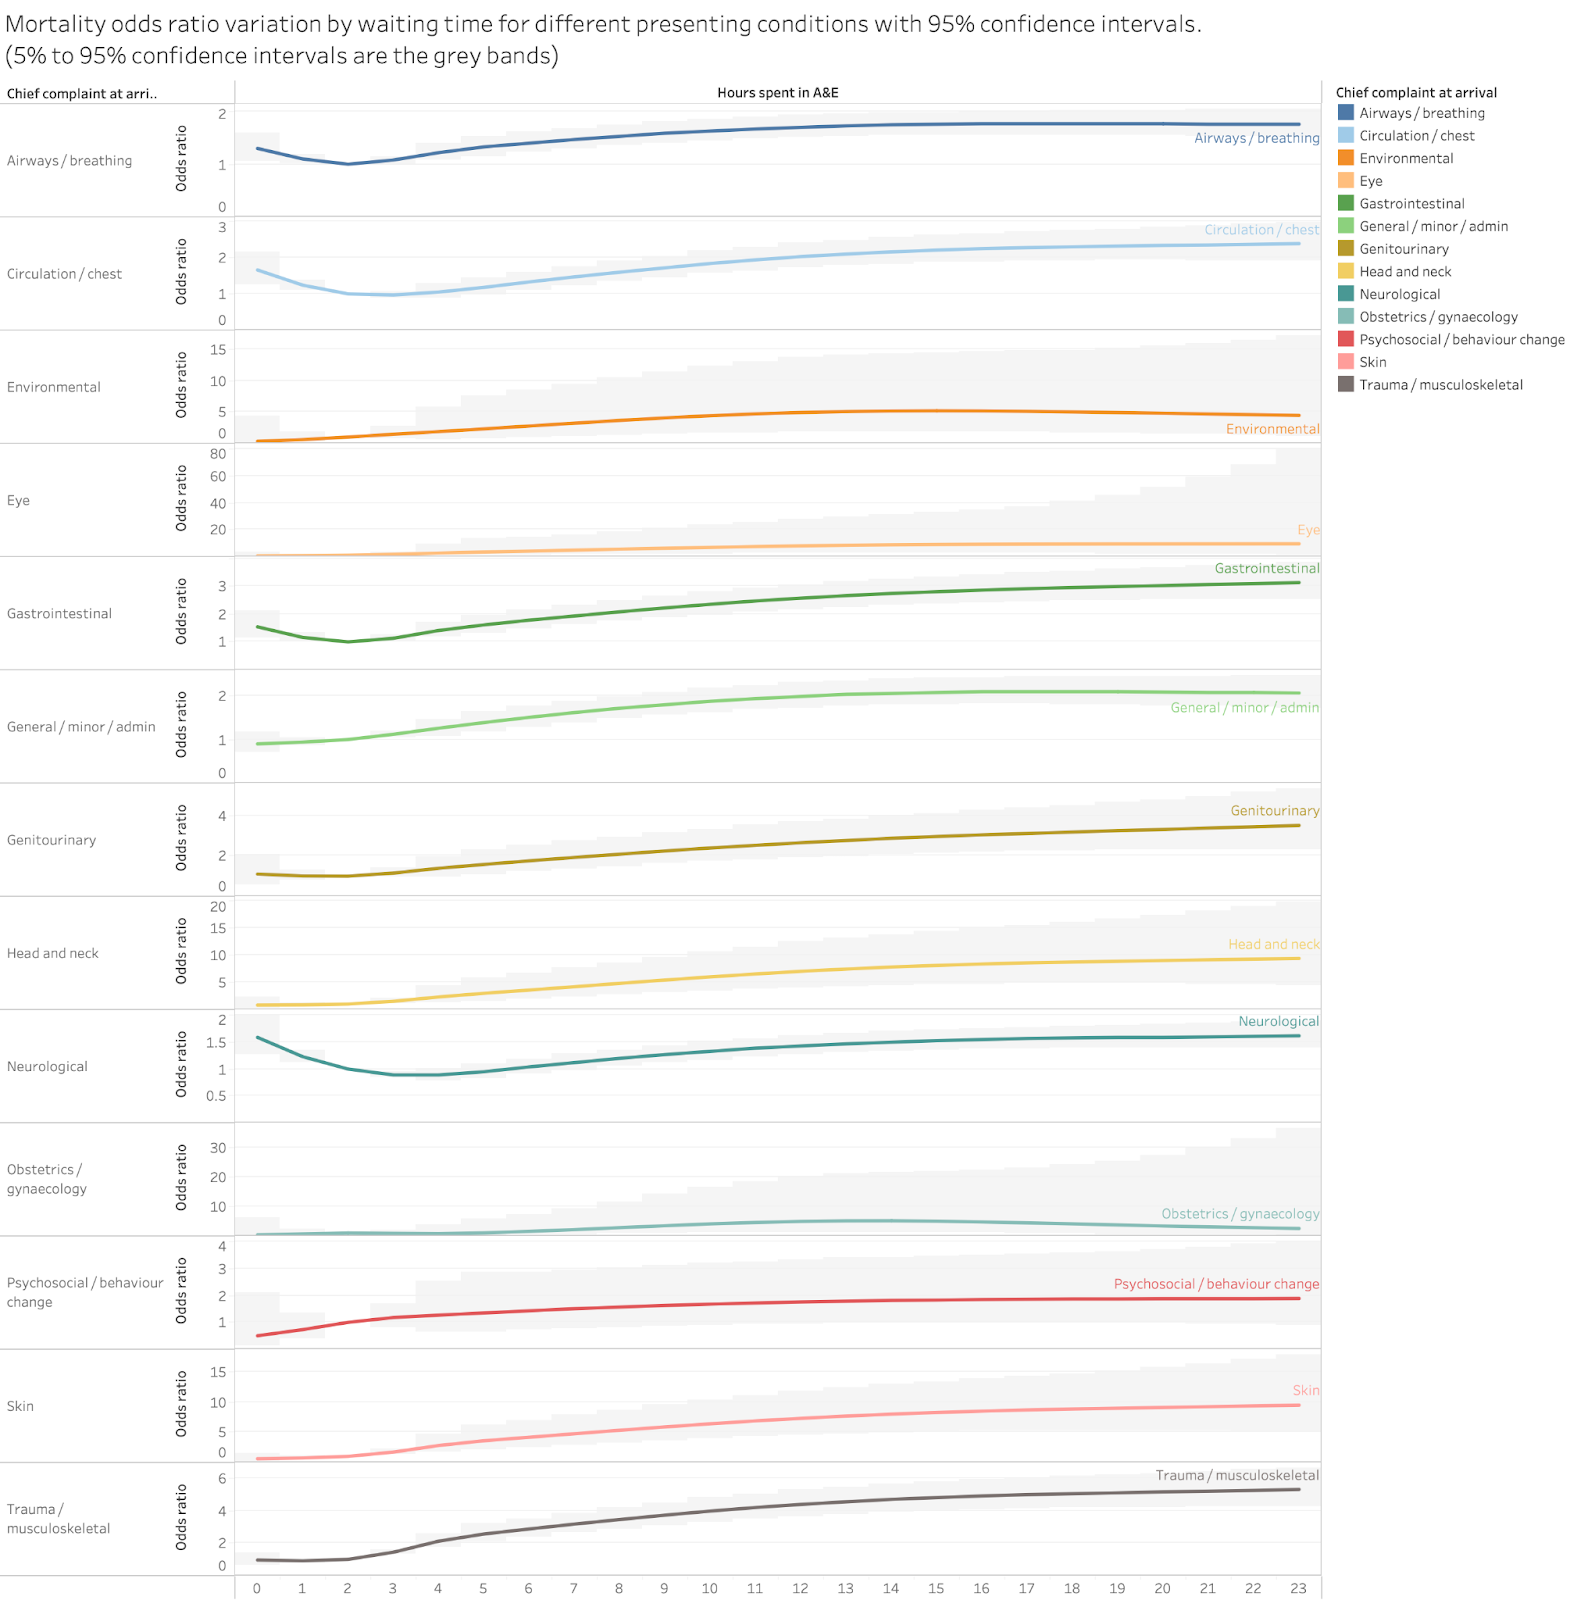
Again, intuitively, different underlying conditions are expected to have different underlying mortalities. The overall picture looks like this (but I’ve eliminated some presenting conditions to keep the chart clearer:
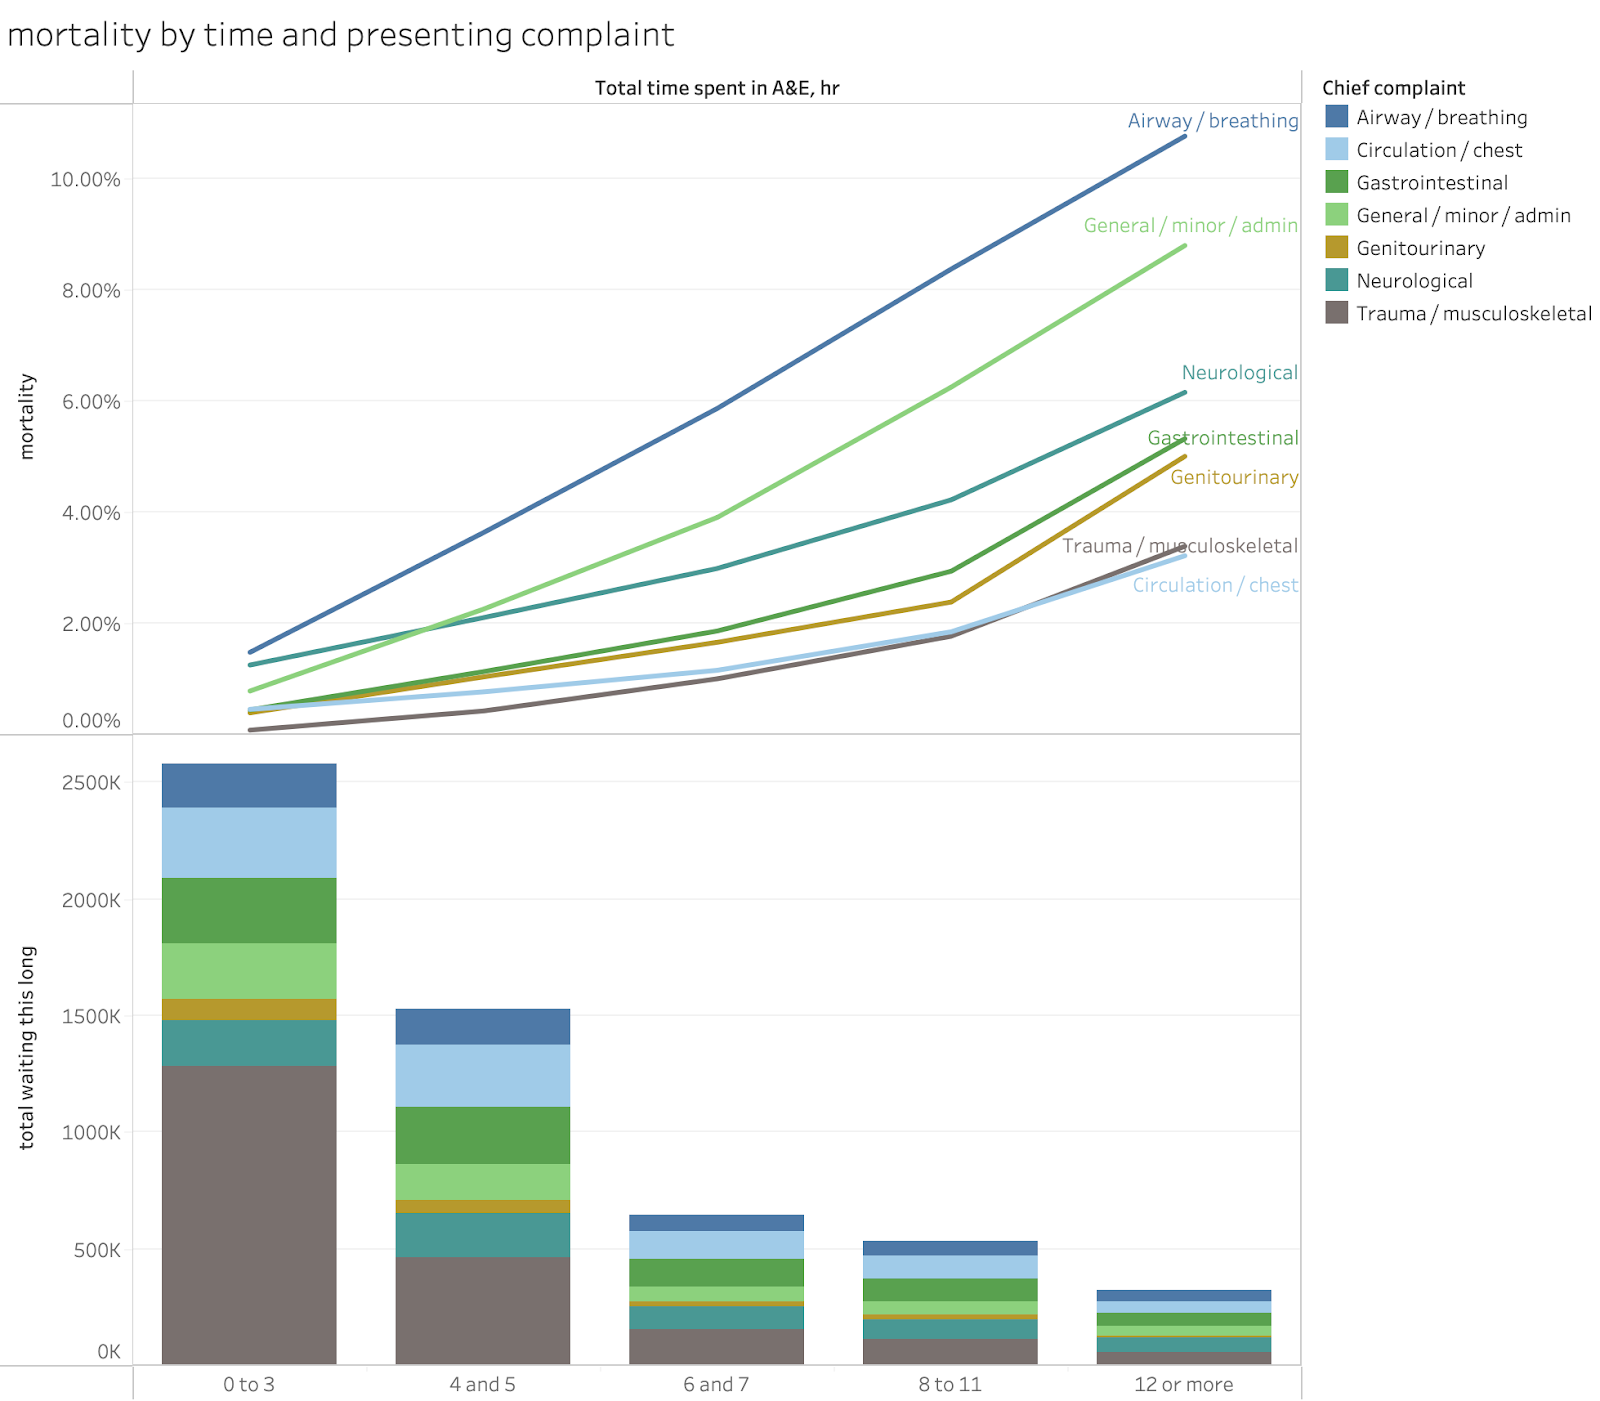
The full table looks like this:

Note the very large difference in the sizes of the groups.
There are also big differences in the base mortalities for the different groups. The groups eye, head and neck, obstetrics and gynecology, skin and trauma and orthopaedics all being below 0.1%. And airway/breathing, neuro, genitourinary, and (surprisingly) general/minor/admin with base rates over 0.5%.
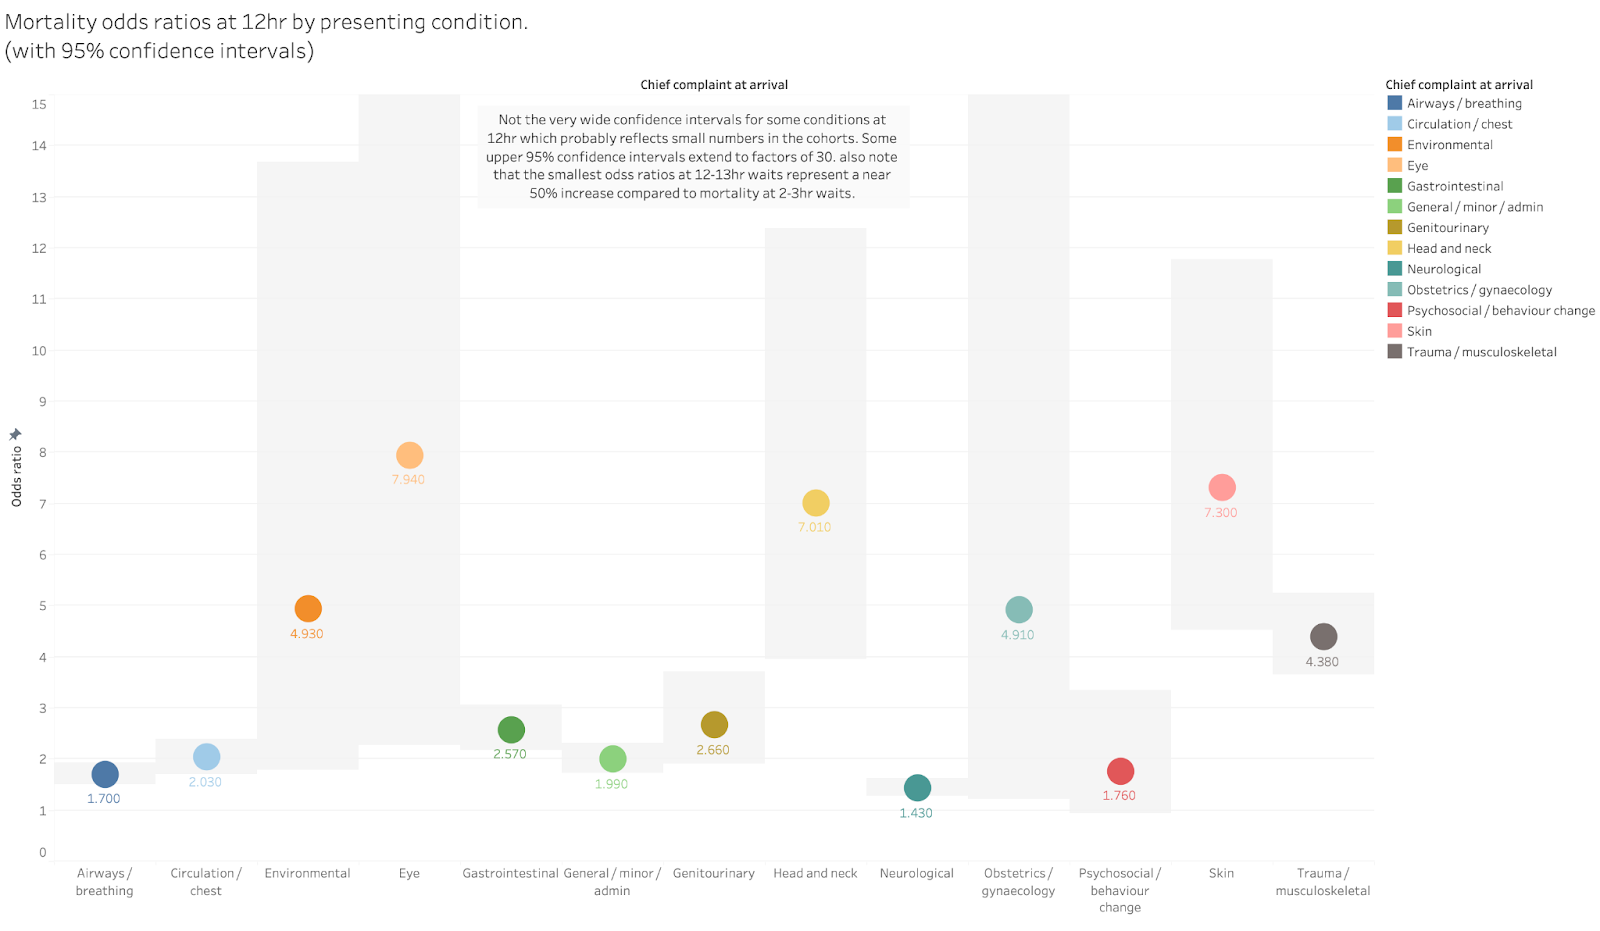
All groups show major relative elevation in mortality rates for long waits but some start so low the rates are not significant even at 12hr.
The total excess deaths implied using this breakdown is about 58k with about 18k of those coming from waits >12hr. This is again in the same ballpark as other estimates and suggests that 12hr waits are disproportionately bad.
Conclusion: excess deaths associated with long waits are the third largest cause of avoidable deaths in England.
The above analysis shows that the majority of the 89k deaths in A&E (technically within 30 days of discharge after an A&E attendance) are associated with waits longer than 4hr in A&E. The excess deaths associated with long waits calculated using different patient subgroups cluster around 50k in 2022 which would make A&E waits the third biggest cause of deaths in the UK that year, exceeding both covid and smoking (obviously those deaths are all included in other ONS categories in the official tables reporting total deaths but the comparison is helpful for understanding the overall magnitude of the problem.
Worse, the problem might be even worse in recent years. For example, in 2022 only a little over 5% of patients waited more than 12hr to leave A&E. Waits over 12hr have been over 10% since 2023 hinting that excess deaths from extreme waits might be twice as bad now as they were then. Even on a crude extrapolation from the numbers provided by the ONS for 2022 this might imply an extra 15k-20k more deaths which might push deaths from long A&E waits to the top position on the ONS causes of death table if they separated these deaths from other assigned causes.
If the calculations above are correct waits of over 4hr in A&E might be accounting for more than 10% of all annual deaths in England. This is not a small problem the NHS can ignore. Waiting times in A&E might be the biggest cause of avoidable harm in the NHS.
Another way to put the numbers into perspective is to compare them with other huge scandals. The NHS contaminated blood scandal was estimated to have led to about 3,000 deaths but that was over more than a 20 year period. The novel painkiller vioxx was estimated to have caused about 50k deaths in the 5 years it was on the market in the USA before its withdrawal. Neither of these comes close to the number of deaths associated with long waits in England’s A&E departments.
There are two possible defences against making this an urgent NHS priority.
One is that the problem is not caused by the NHS. NHSE spent a lot of time claiming the problem was the result of excess demand, not a dysfunctional NHS. But demand isn’t the problem and never has been.
The other defence is that the NHS has no known strategies that work to reduce long waits. This might actually be true for the NHSE’s outgoing leadership who have persistently pursued bad strategies. But it is a little hard to sustain if your corporate memory extends beyond the last decade. Fewer than 2% of attendances waited over 4hr in 2010. A&E performance had seen huge improvements from 2002 to 2005 when the 98% target was first achieved. Good performance was sustained for 9 years after 2005 despite Andrew Lansley’s poor decision in 2010to relax the standard to 95% (which caused a decline in performance by signalling that A&E speed was no longer a priority). It isn’t that A&E performance can’t be fixed, it has been fixed but the NHS forgot how it was fixed.
It needs to rediscover how it was once fixed as current performance is causing too many deaths for the problem to be ignored.
Notes and caveats
There are some important points to note when looking at the ONS analysis.
The analysis differs from previous analyses of A&E mortality in looking at the mortality by patient not attendance. The previous EMJ analysis used mortality rates per attendance for admitted patients only and is not directly comparable. The ONS looked only at mortality per unique patient (presumably on their last visit to A&E that year). This also means that the mortality rates cannot be directly applied to current attendance to estimate current mortality levels (unique patient statistics are not normally part of the A&E statistics that get published).
The assertion that longer waits cause extra deaths might upset some purist statisticians who demand randomised controlled trials to confidently assert causality. But those are clearly unethical. But even if we don’t make a confident claim of causality, the numbers estimated from a range of different analyses of comprehensive historic data are consistent in shining a very bright flashing red light in the direction of the claim that long waits cause a large number of deaths that would not happen with shorter waits.
Another possible objection is that the ONS have not released the cross-tabs (eg the breakdown of deaths by discharge status and age and acuity etc.). They have promised some of this data and analysis in a future publication. This might allow some separation of the interactions between different factors which might modify the calculation of excess deaths by a small amount. Though the results above suggest this would not be by much. Time in A&E seems to independently relate to higher rates of death for every subgroup studied and the excess death calculations are all in the same ballpark.
And, don’t forget, the factual reporting of deaths in 2022 show that the majority of all deaths related to A&E attendance were associated with waits longer than 4hr. That’s a basic fact, not speculation. Further analysis might highlight the relative contributions to each link in the chain of cause and effect but they won’t alter the overall picture. Long waits kill patients.
And the mortality rises with time, sometimes steeply. So the first priority will have the biggest impact if it tackles very long waits. Nobody argues that 12hr waits are acceptable but recent policy has tried to reduce the waits >4hr as the major metric of success at the cost of allowing 12hr waits to rise. While having few waits over 4hr is a desirable goal, improvement programmes should target a rapid reduction in the very long waits over 12hr first. This policy focus would lead to a bigger reduction in excess deaths and might trigger the sort of notable improvement that would create the momentum so completely lacking in current plans.