This is a technical post intended to remind me of what has to be done to make sense of English prescribing data, an amazingly useful open dataset that summarises everything dispensed in the community in England (which accounts for about £8bn or about 8% of NHS spending every year). For all its usefulness, it is a pain to do analysis with it for a variety of reasons. I hope that by describing how to make sense of it my notes will also be helpful to others. I may update this as I work further with the data.
Introduction
The trouble with english prescribing data is that, although it has been openly available since 2010 (every month we can see exactly how many prescriptions of each type are dispensed in the community) it isn't easy to make sense of it.
The raw data released by NHS Digital consists mainly of a file detailing the BNF code (a 15 character code describing the exact item being prescribed, BNF is the British National Formulary), the GP or clinic code for the issuer of the prescription, and the amount of things prescribed (by book price, actual cost after discounts and charges, number of pills/volume/units). What it doesn't have is the sort of metadata that helps you group these things together into useful categories (GPs mapping to CCGs or the grouping of drugs into categories).
The BNF code does contain useful information to solve some of that problem and there are lookups for the mapping of GPs onto bigger units. But these have to be downloaded from other sites and the extra data doesn't always map neatly onto the raw data. This blog describes how I sort, wrangle and combine the sources to make something more useable partially to help me remember and also so others can see roughly what is required if they want to play with the data.
BNF codes
BNF codes actually contain a hierarchical coding that groups drugs and devices into categories. The codes group drugs into chapters, sections, paragraphs and subparagraphs. Chapters are mostly about what sort of problem the drug deals with. For example, there are chapters for drugs treating the digestive system, drugs treating infections and devices for incontinence. The other levels group these together in a fairly reasonable hierarchical classification. It works like this:
- Characters 1-2 code the chapter
- Characters 1-4 code the section
- Characters 1-6 code the paragraph
- Characters 1-7 code the subparagraph
- Characters 1-9 code the chemical or device
- Characters 1-11 code the product (often essentially the same as the chemical)
- The remaining characters code the specific item (different versions of the item, different formulations of the same drug, different strengths of pill, etc.)
There are some complications on top of this, though. Dressings and appliances only have 11 characters in their codes (though the raw data makes all codes 15 characters long by right-filling the codes with blank spaces, some metadata sources use a mix of 11 and 15-character codes just to be really annoying).
So, while we can derive a hierarchy from the raw data, we need to find a source for the names of chapters, sections, paragraphs and so on (the raw data comes with a file describing the names of each specific item's formulation). We could just buy the latest BNF (available in book form with all sorts of useful advice about drug use, safety and dosage and updated every six months). But the book is over 1,000 pages long and there are nearly 40,000 items to code so it isn't a very practical way to get the metadata unless you are both a masochist and a good typist.
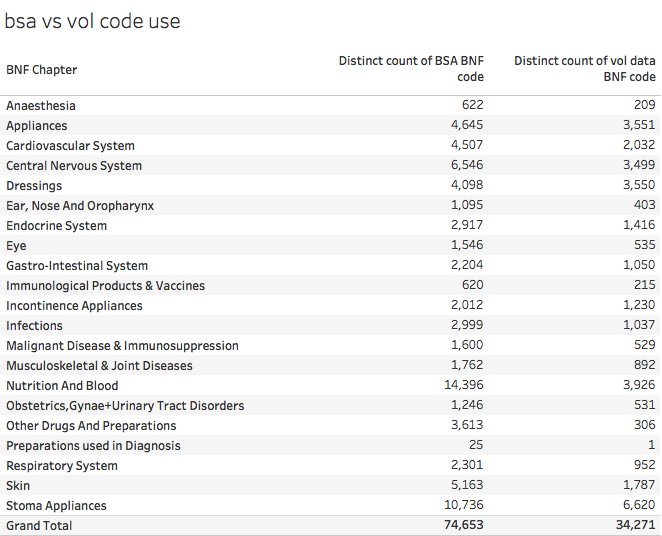
Annoyingly the BNF doesn't, as far as I can tell, release an electronic form of the data (even their iOS app requires an Athens login presumably in a futile attempt to prevent non-qualified people misusing the data even though those who want to can just buy the physical book). But the BSA (the NHS Business Services Authority, who compiles the data from the raw prescriptions used to pay pharmacists), does. It is accessible as described in this useful opendata.stackexchange post. But the BSA have a deserved reputation for being annoying awkward bastards when it comes to open data. The opposed making the raw data available as opendata when Tim Kelsey originally proposed the idea. Their own tools for accessing the data are clunky, slow and primitive. And they don't fall over themselves to make anyone else's life easier. For example, their metadata is coded using both 15 character and 11-character BNF codes (unlike the raw data which pad all codes to 15-characters long). Worse, the lookups are inconsistent from year to year (the 2016 release has 35,673 BNF codes but the 2017 release has 74,653 even though the entire public dataset doesn't have that many unique codes in it). Worse still, not every code in the public data has a matching code in the metadata file.
It is unclear why there are so many more codes in the latest BSA metadata. Here is how this looks compared to the number of codes actually used in the raw volume data:
And this understates the scale of the problem as some of the codes in use don't match anything in the metadata. This table shows that problem:
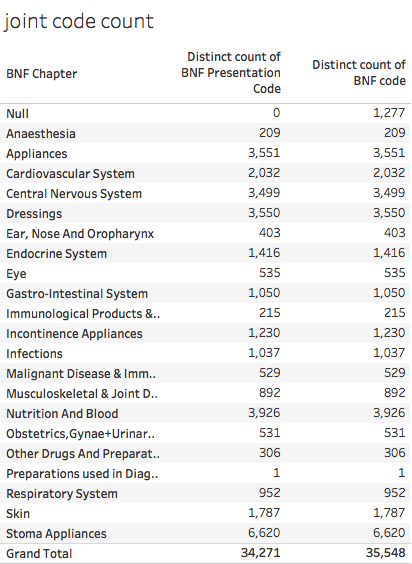
This table shows that 1,277 codes in the raw data are not present in the 2017 metadata at all.
This is pretty fucking annoying for those of us who want to do analysis.
All is not lost. The correct position in the hierarchy can be retrieved for the things actually prescribed as their codes contain some of the information about their position in the hierarchy (remember the BNF code contains the chapter, paragraph etc. codes).
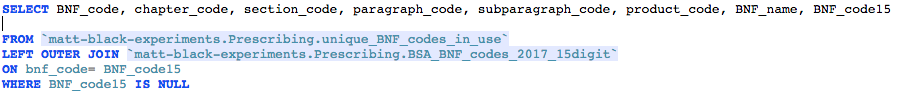
So we can highlight the 1,277 missing BNF codes by doing some SQL magic in BigQuery:
And then we can reapply the known chapter, section etc. values, where they exist. Unfortunately, they don't always exist because the BNF sometimes revise the hierarchy, adding new ways to classify drugs. The biggest change recently was the introduction of a new paragraph and subparagraph classification for drugs used in substance abuse. This replaced the codes of drugs with new codes but means that the old codes won't fit correctly into the new classification. This can be fixed manually, though it is a pain in the arse to do so.
In addition, the raw data files containing metadata for chemical/product names uses a different structure for the chemical codes for the chapters consisting mostly of devices and dressings (all chapters>19). Instead of a 9-digit code the product/chemical is described by a 4-character code (ie the same as the paragraph code).
But, despite these difficulties, I persisted anyway. I extracted the codes actually used in the raw data and filled in (to the best of my ability) the missing hierarchy parts so that I could produce (nearly) complete classifications of everything actually prescribed.
Prescriber Locations
Then we have the problem of knowing who prescribed and where they are geographically. The raw data contains the prescriber code (some clinics but mostly the standard code for GP Practices). It also contains fields described as SHA and PCT.
Unfortunately the NHS has been reorganised since the data was first published and both Strategic Health Authorities (SHAs) and Primary Care Trusts (PCTs) were abolished and replaced by NHSE Area Teams (NHSats or some acronym like that) and Clinical Commissioning Groups (CCGs). The data in the SHA and CCG columns switches to new codes somewhere in the middle of the timeseries. This is sensible, but has the major disadvantage that the raw codes don't allow a consistent set of regional comparisons over time even though the actual people doing the prescribing are the mostly same (neglecting the small number of closed and new GP Practices). Another problem is that the fields contain codes that are not regional or local bodies. Some look like the codes of hospital trusts; sometime SHA codes appear in the PCT field and sometimes codes are used that don't appear to match anything I recognise.
There are two ways round this problem. One is to use the geography of postcode locations to map the locations of practices onto the area where the postcode is located. The ONS produces lookup tables showing the higher-level geographies each of the ~2.5m postcodes in the UK resides in. This won't always match the actual NHS administrative hierarchy for GPs, but is is close and we can extract the relevant NHS codes from a single lookup table, the ONSPD table which is large but manageable and downloadable from the ONS Geography portal.
The alternative is to match GPs to CCGs using the lookup tables NHSE are supposed to provide. This should be exact, but the tables are not always up to date and some codes were altered after the original release (presumably just to make life harder for analysts like me). And CCG membership and boundaries have changed several times due to GP defections, and CCG mergers/splits. Since doing consistent geographic analysis is clearly a waste of time for everyone, why should I expect this to be made easy for me?
Even if we use the NHS GP to CCG lookups, we still need the ONSPD file to identify the precise location of practices. This file, at least in recent versions, give the lat/lon of every postcode so enabling location maps with little fuss if your choice of analysis software can map using lat/lon (I use Tableau which can draw a map as soon as you give it a lat/lon).
Back to the raw data which has some further traps for the unwary. Alongside each month's prescribing data, NHS Digital release a file containing the lookup from prescriber code to prescriber name and full address. WOOT! You might think, problem solved. Unfortunately not completely as there are some consistency problems. For each practice code there are a practice name and 4 address fields in the data. The last two address fields should contain town and area, but often don't. Sometimes the last field is town; sometimes it is blank; sometimes the town fields contains a third address. Luckily we rarely need those full addresses so we don't need to fix these inconsistencies. But we do need the postcodes and they are, at least, all in the same column of the data.
But not in a consistent format for fucks sake. There are several possible standard ways of formatting postcodes (the ONSPD file has three alternatives in case your data uses a different one). This happens because postcodes have different numbers of characters (for example, B1 7PS; BT6 1PA; SG18 2AA; SW1W 9SR). You can force fit all postcodes to 7 characters (some will now have no spaces), 8 characters (some will have multiple spaces) or a variable length which always has just one space in the middle. The raw data for prescriptions is supposed to be in the variable length format. And it often is, but not always. In some months some of the postcodes have an extra trailing space which means that any lookup to location using the ONSPD file fails. It is easy to fix (databases and spreadsheets have TRIM functions to remove redundant space) but why didn't NHS Digital apply this before releasing the damn data. It isn't as if they are even consistent every month.
This isn't the only problem with the postcodes. Some of them are wrong. It is almost impossible to tell this unless you draw maps and observe locations over time (I do which is why I spotted the problem). Some practices change postcode over time in ways that don't make sense. Sure, some practices move location to new buildings and get a new postcode. But in the data some make leaps of hundreds of miles and then move back. On investigation, some codes have been transposed from practices near them in the list in some months. This isn't common, but suggests that some analyst has been making transposition errors when putting the data together and hasn't found a reliable way to validate the whole monthly dataset.
Putting it all together
Now we have a (mostly) complete way to classify drugs we can look at the whole hierarchy. A summary is given below:
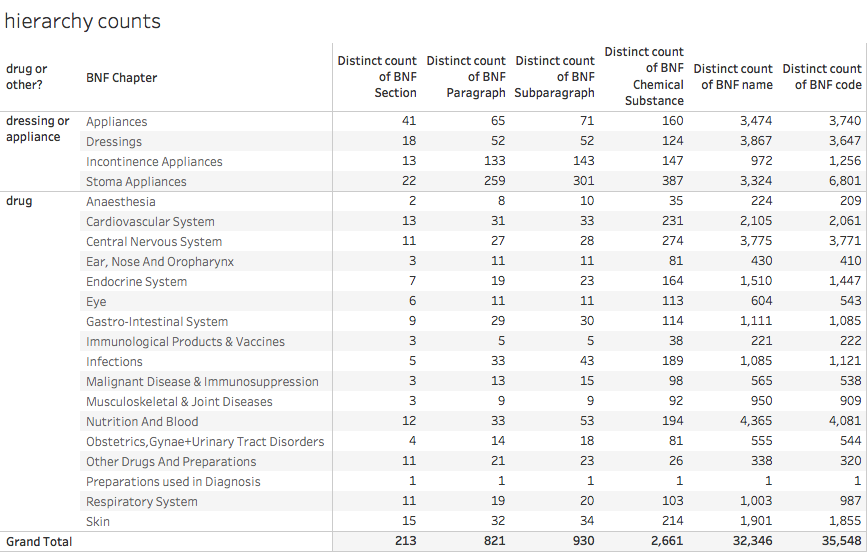
Note that the number of distinct names doesn't entirely correspond to the number of distinct codes. This is because of several factors: sometimes the name is changed over time for exactly the same product; sometimes the hierarchy is reorganised giving existing drugs a new BNF code (for the same exact product) and a variety of other reasons.
Normalising the results
Sometimes we need to know more than just the total amount prescribed. When we want to compare GP Practices, for example, we need to account for the fact that GP lists have a wide range of sizes and population demographics. A fair comparison of two GPs requires adjustments for both the size and age mix of their populations. The old pop a lot more pills than the young so any comparison needs to adjust for the age mix or it won't be fair.
The simplest normalisation is pills per head which is easily derived from gP Practice List size. A better comparison needs to use the whole demographic profile for the population on the list. Two common schemes are to use units known as ASTRO PUs and STAR PUs. ASTRO PUs take into account the age/sex mix by defining a standardised rate of prescribing by number or spend for different age/sex bands in the population (which is originally based on the English average rate though the actual analysis is only done every few years). STAR PUs are defined for specific categories of drugs where the national rate may be inappropriate.
An ASTRO PU (item or cost) is the cost or number of items that a practice would be expected to incur if it prescribed in exactly the same way as the average practice in England. Per quarter (so you need to adjust the timescale if you are working with units other than quarters). I create a table of monthly ASTRO PUs from the quarterly population data so I divide the values by 3 to get an expected monthly number of units.
But deriving the relevant factors for a Practice is not simple as list sizes change over time. And, as usual, you have to find the data, which isn't trivial. The NHS BSA have some but it only starts in 2014 (our prescribing data starts in mid 2010). NHS Digital have quarterly data from 2013 and, if you search carefully enough, some data from 2011. But no obvious single series going back to before 2013.
And that isn't the only problem with the data. Recent quarters add the useful extra information containing the ONS standard codes for NHS geographies as well as the NHSE codes. But this means the files are now in a different format and must be edited before being combined into a single source. Plus the file names are inconsistent and don't (usually) contain date information so you have to edit that in manually.
To add some anal-probing to the severe beating the poor bloody analyst has already taken, they extend the age bands in 2014 and later data to include 85-89 and 90-95 (previously ended with 85+).
In fact here is a suggestion for how NHS Digital could make everyone else's life easier: copy the Land Registry. They release monthly files of house sale transactions in a consistent format that is easy to join together if you want to create a bigger dataset covering a long time interval. And they also publish a single consolidated (and very large) file that contains all the data they have ever released so you can get a consistent single file with all the data you want with just one download. Or you can do the big download to get started and then update every month from the monthly release without worrying about consistency or manual edits.
Conclusion
The bottom line is that making sense of England's prescribing data is possible, but, at least for parts of the relevant data, unnecessarily hard. The difficulty of deriving joined-up datasets that can be visualised is far, far harder than it should be. It is as if there were a conspiracy to stop open data actually being useful.
NHS Digital could help. They could release the data and all the associated data in a single place where users could use it immediately. They could create repositories that release the data in a single lump rather than in monthly extracts. This wouldn't be easy as CSV files (the result would be far too big compared to the Land Registry where the accumulated file containing all house prices since the mid 1990s is only ~3GB as a single CSV. But there are people would probably do it for free if asked nicely: Google already host bigger public datasets on their BigQuery data warehouse and Exasol have assembled the core parts of the prescribing dataset on a public server for demonstration purposes (see http://www.exasol.com/en/dataviz/ where you can register for access to this and other interesting datasets and many examples of data visualisation based on them). This is the sort of thing that NHS Digital ought to do to encourage the use of their data. Diesseminating it isn't enough.
I should also mention that Ben Goldacre and Anna Powell-Smith have produced an online viewer (https://openprescribing.net) for many aspects of the data but it doesn't (yet) have true freedom to explore any aspect of the data any way you want.
And, not forgetting, my Tableau Public summary of the national data (which leaves out GP-level data to fit into a public worksheet).
And, not forgetting, my Tableau Public summary of the national data (which leaves out GP-level data to fit into a public worksheet).