Long waits in A&E kill patients and NHSE denials are not an appropriate response

This is a long blog, sorry. But I wanted to document in more detail the key arguments about the excess deaths and the NHS response.
The Royal College of Emergency Medicine has been campaigning strongly on its estimates of the mortality caused by long waits in A&E departments. RCEM recently updated their estimates using new data about how many long waits there were last year. The response from NHSE continued to be denial rather than action.
Partly because the NHSE response continues to repeat what are, at best, extremely misleading ideas and, at worst, deliberately devious distractions from an important issue, I think it is worth a longer look at the topic to clarify where the numbers come from and whether the NHSE response is credible.
The background and history
The Royal College of Emergency Medicine attracted headlines in most media in early April 2024 (The Guardian, The Times, Sky News, The BBC, and even the Telegraph) with a new estimate of the number of excess deaths caused by long accident and emergency waits.
Their updated calculations suggested more than 250 extra deaths are occurring every week because of long A&E waits. They had released similar analysis in 2022 and their president, Adrian Boyle, had explained and defended their calculations in front of the House of Commons Health committee in January 2023 where Chris Hopson, the NHSE propaganda Strategy Director responded alongside a couple of other senior directors. Adrian Boyle did a good job but the NHSE response basically consisted of denial and diversion.
The key responses from NHSE in 2024 are largely the same. It is worth recording some of them as this will become important when I dig into the detail later.
Chris Hopson made 3 key points to the Health Committee:
“The first issue is the pressure on the urgent and emergency care pathway. We know that the NHS has been under an unprecedented degree of pressure on that pathway. We know that has led to significantly longer waits than we have seen before and we know that those longer waits are associated with poorer outcomes.”
“The second issue is that at the same time—Chair, you quoted these figures in your earlier questioning—we are seeing higher levels of excess deaths over the winter months. Those higher levels of excess deaths are not unusual. That will obviously reflect flu, cold weather snaps and covid….It is right, as I said when I did my interview, that experts at the ONS, supported by the chief medical office and working with the chief medical officer, continue to analyse the reasons for that higher level of excess death.”
“The third issue is that obviously, when you combine the two, which is the link between the pressures on the urgent and emergency care pathway and the higher levels of excess mortality, the widely quoted 300 to 500 a week figure that is, as you have heard, based on a study in the Emergency Medicine Journal suggests a link to delays in admitting patients from emergency departments and all-cause 30-day mortality. The key phrase is “suggests a link”. … that figure of 300 to 500 cannot be definitive and does not give a full and certain picture. That is why both I and our chief medical officer, Sir Steve Powis, said we did not recognise that figure, while … recognising that longer waits are associated with poorer outcomes.”
The press release in response to the 2024 RCEM estimates basically repeated shorter versions of these arguments. It added a claim that performance had turned the corner and was now improving That claim relied on a small improvement in 4hr performance in march when NHSE put a great deal of pressure on the system to meet a 76% interim improvement target. That target was still missed by 2% and the total number of 12hr waits in the year to march 2023 was down just 24k from the 1,733k in the previous year). You can judge for yourself whether that counts as a notable amount of improvement.
Those claims are problematic
Even without examining the details of the RCEM calculation, it is easy to see why the NHSE response is deeply disingenuous. A charitable interpretation is that the senior directors at NHSE who have commented didn’t understand the RCEM analysis as presented at the Health Committee. But they had a year to do some homework since the data used by the RCEM had been published. And they have failed to change their responses in the 15 months since the committee hearing which undermines that explanation.
Hopson’s first point was that “pressure” (which I think means volume of patients) is causing poor performance. That pressure, he claims, leads to longer waits so it isn’t the NHS’s fault. But this point is directly contradicted by the analysis in the new UEC Strategy also released in January 2023 which clearly states “the number of attendances is not the thing primarily driving performance” (BTW, that admission represented a major reversal of NHSE strategy for improving emergency care which had for a decade sought to divert patients away from A&E to lower volumes in the hope it would improve performance despite multiple previous analyses saying it would not). Hopson’s claim that “We know that has led to significantly longer waits than we have seen before” is directly contradicted by his own strategy. To be fair, the new strategy was published a few days after the committee hearing, so perhaps he hadn’t read it yet. Right?
The second claim is basically that excess deaths in winter are normal and expected. Indeed the ONS weekly excess deaths statistics show that more people die in winter. The NHSE argument is basically “Nothing to see here, move along”. But this is either a deep misunderstanding of both the RCEM claim and the ONS excess deaths publication or a deliberate attempt to distract from the implications of the RCEM results. The unfortunate use of the same name “excess deaths” might contribute to some confusion but the details of how the RCEM reached that conclusion show that the only link is the name (I will explain more later when I show how the original estimate was done).
The third claim exploits the statistical caution of the RCEM and the original authors who knew they could not prove causality in a non-randomised study. But imagine trying to get a study where A&E arrivals were randomly allocated to different lengths of wait past any ethics committee. The question is how robust are the estimates from a good observational study given a randomised trial proving causality is impossible. I will come back to this when I explain how the original estimates were done. The key point is that NHSE have tried to avoid engaging with the detail of the estimates by dismissing the results as something they don’t recognise.
What was the basis for the original analysis by the RCEM?
The RCEM estimates are derived from a major study in the Emergency Medical Journal (EMJ) published in January 2022. To understand the basis of the RCEM calculations I first need to explain how the original EMJ paper was done (luckily, I’m a co-author).
The motivation for doing the EMJ study was twofold. One reason was to understand the extent that A&E performance was deteriorating and the consequences of that. The other was to provide some more concrete evidence about why having a 4hr target was so important. At the time the study was started, performance was declining and many were questioning whether the standard was merely an arbitrary management target or was based on measurable clinical criteria (the original standard was driven by clinical experts but a decade later many had forgotten this).
I had realised that–now the patient level A&E data was reliable and the ONS kept a linkable dataset of deaths within 30 days of hospital discharge–it was possible to measure the mortality rate of groups of patients with different characteristics. In particular it would be possible to measure whether patients with long waits had higher mortality than those with shorter waits. Some studies in other countries had suggested that long waits did increase mortality for all patient types. But those other studies used less comprehensive data than the available data held by the NHS. We could do better.
The statisticians involved in the EMJ team realised that, in order to get unchallengeable results, it would be important to rule out some of the possible confounders. In particular, it feels intuitively obvious that sicker or older patients need longer treatment times in A&E (which would imply that the cause of higher mortality would be their clinical state, not the length of time they waited). On the other hand, almost no NHS patients waited longer than 4hr in 2010 which suggests that time spent in A&E is not itself caused by clinical need. Volume of patients had not changed dramatically since 2010, there were far more doctors but speed/performance had declined a lot. Nevertheless the statisticians wanted to have enough data to rule out confounders like morbidity and age. So the team chose to look only at admitted patients where the inpatient HES data gives far richer evidence on patient morbidity and than the A&E HES data.
So that is what the study did. Two years (from 2016-2018) worth of patient-level data from all English A&E admissions (about 5m admissions in total) was linked to the ONS 30-day mortality data enabling direct measurement of the mortality rates of patients with different characteristics, including how long they waited to be admitted. It is important to note that the study is not estimating mortality, it is estimating which factors are related to observed mortality.
To cut out a lot of detail, the study showed that the waiting time before admission made a significant difference to the mortality rate even after adjusting for other possible confounders.
Crudely the overall mortality rate for admitted patients is about 8%. But for patients who wait between 8 and 12hr, that rises to nearly 10%. What the study estimates is how many extra deaths there are for patients with longer waits compared to the mortality for those who wait less than 4hr. In fact the mortality rises linearly for every extra hour waited beyond 4hr. For every 191 waits between 4 and 6 hr there is one extra death; for every 72 waits of 8-12hr there is an extra death. There were not enough >12hr waits to get a good estimate of the mortality there but, given the strong trend of higher mortality with longer waits, it is reasonable to conclude that it is higher for waits longer than 12hr. Obviously there are some error bars worth adding, but given the base data includes 5m individual patient records, there is a lot less uncertainly than you might think.
This chart from the paper summarises the relationship (SMR is the standardised mortality ratio):
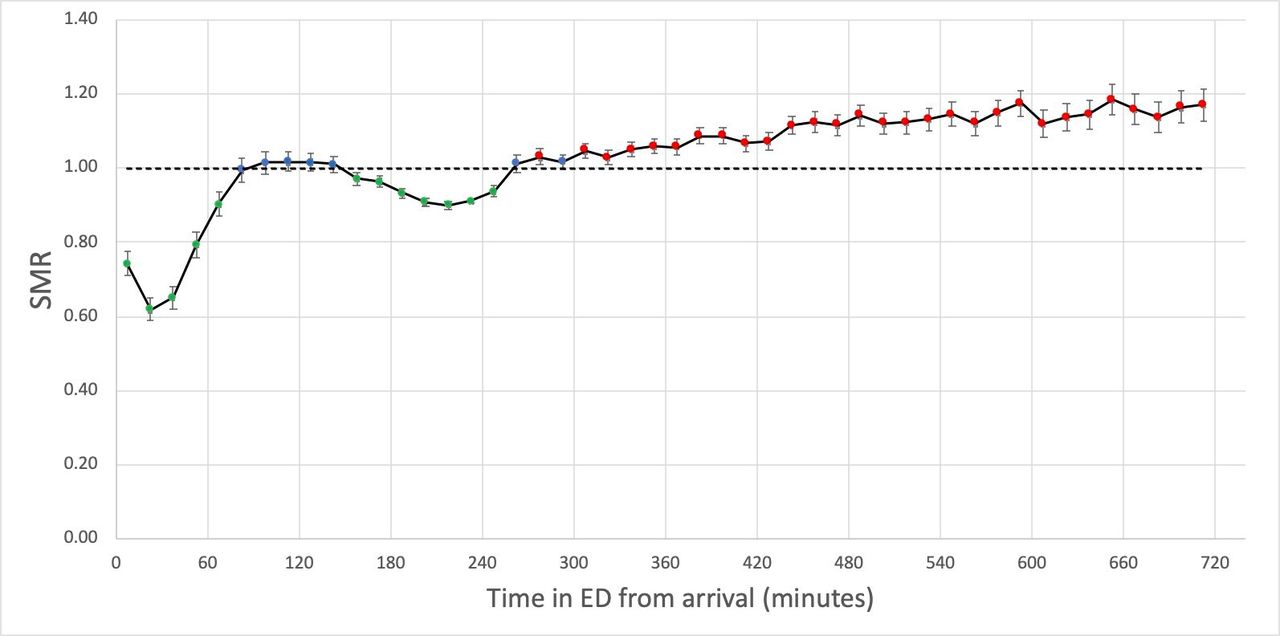
The basic conclusion is that long waits before admission are associated with higher death rates even after considering patient morbidity. Since it isn’t an RCT, careful statisticians won’t claim they can prove causality, but this is a big study done carefully that comes as close to estimating causality as it is possible to get. It might technically be an association, but there are big flashing red lights hinting that the effect is real, significant and causal.
One other thing worth noting is that the study was not funded. NHSE didn’t pay, nor did any other body or think tank. Everyone involved gave their time freely because they recognised the importance of getting hard evidence.
All the subsequent estimates by the RCEM and others are based on the mortality rates observed in the EMJ study updated to reflect the number of long waits in later years.
How does the RCEM turn numbers of long waits into estimates of excess deaths?
Most of the estimates of current excess deaths apply the results of a simpler grouping of waiting times and mortality in the EMJ paper to current counts of waiting times in A&Es.
For convenience the paper calculated NNH (number needed to harm) for 3 different groups of waiting times: 4-6 hr (191); 6-8hr (82); and 8-12hr (72). What the NNH means is that, for example, there is one extra death for every 191 patients waiting between 4 and 6 hours.
These can directly estimate excess deaths from the known numbers of patients waiting in those time bands. Assuming, of course, that the mortality rates have stayed similar to the rates in the period under study.
But the A&E statistics that are normally published don’t count the number of waits in those bands. Total waits >4hr is routinely published (that is the definition of the A&E target). But, due partially to a media furore in 2016 triggered by the increasing number of anecdotes about 12hr waits, NHS Digital did start publishing annual totals of 12hr waits.
The following chart shows those totals (the red line is annual count of 12 hr waits) in the context of total major A&E attendance):
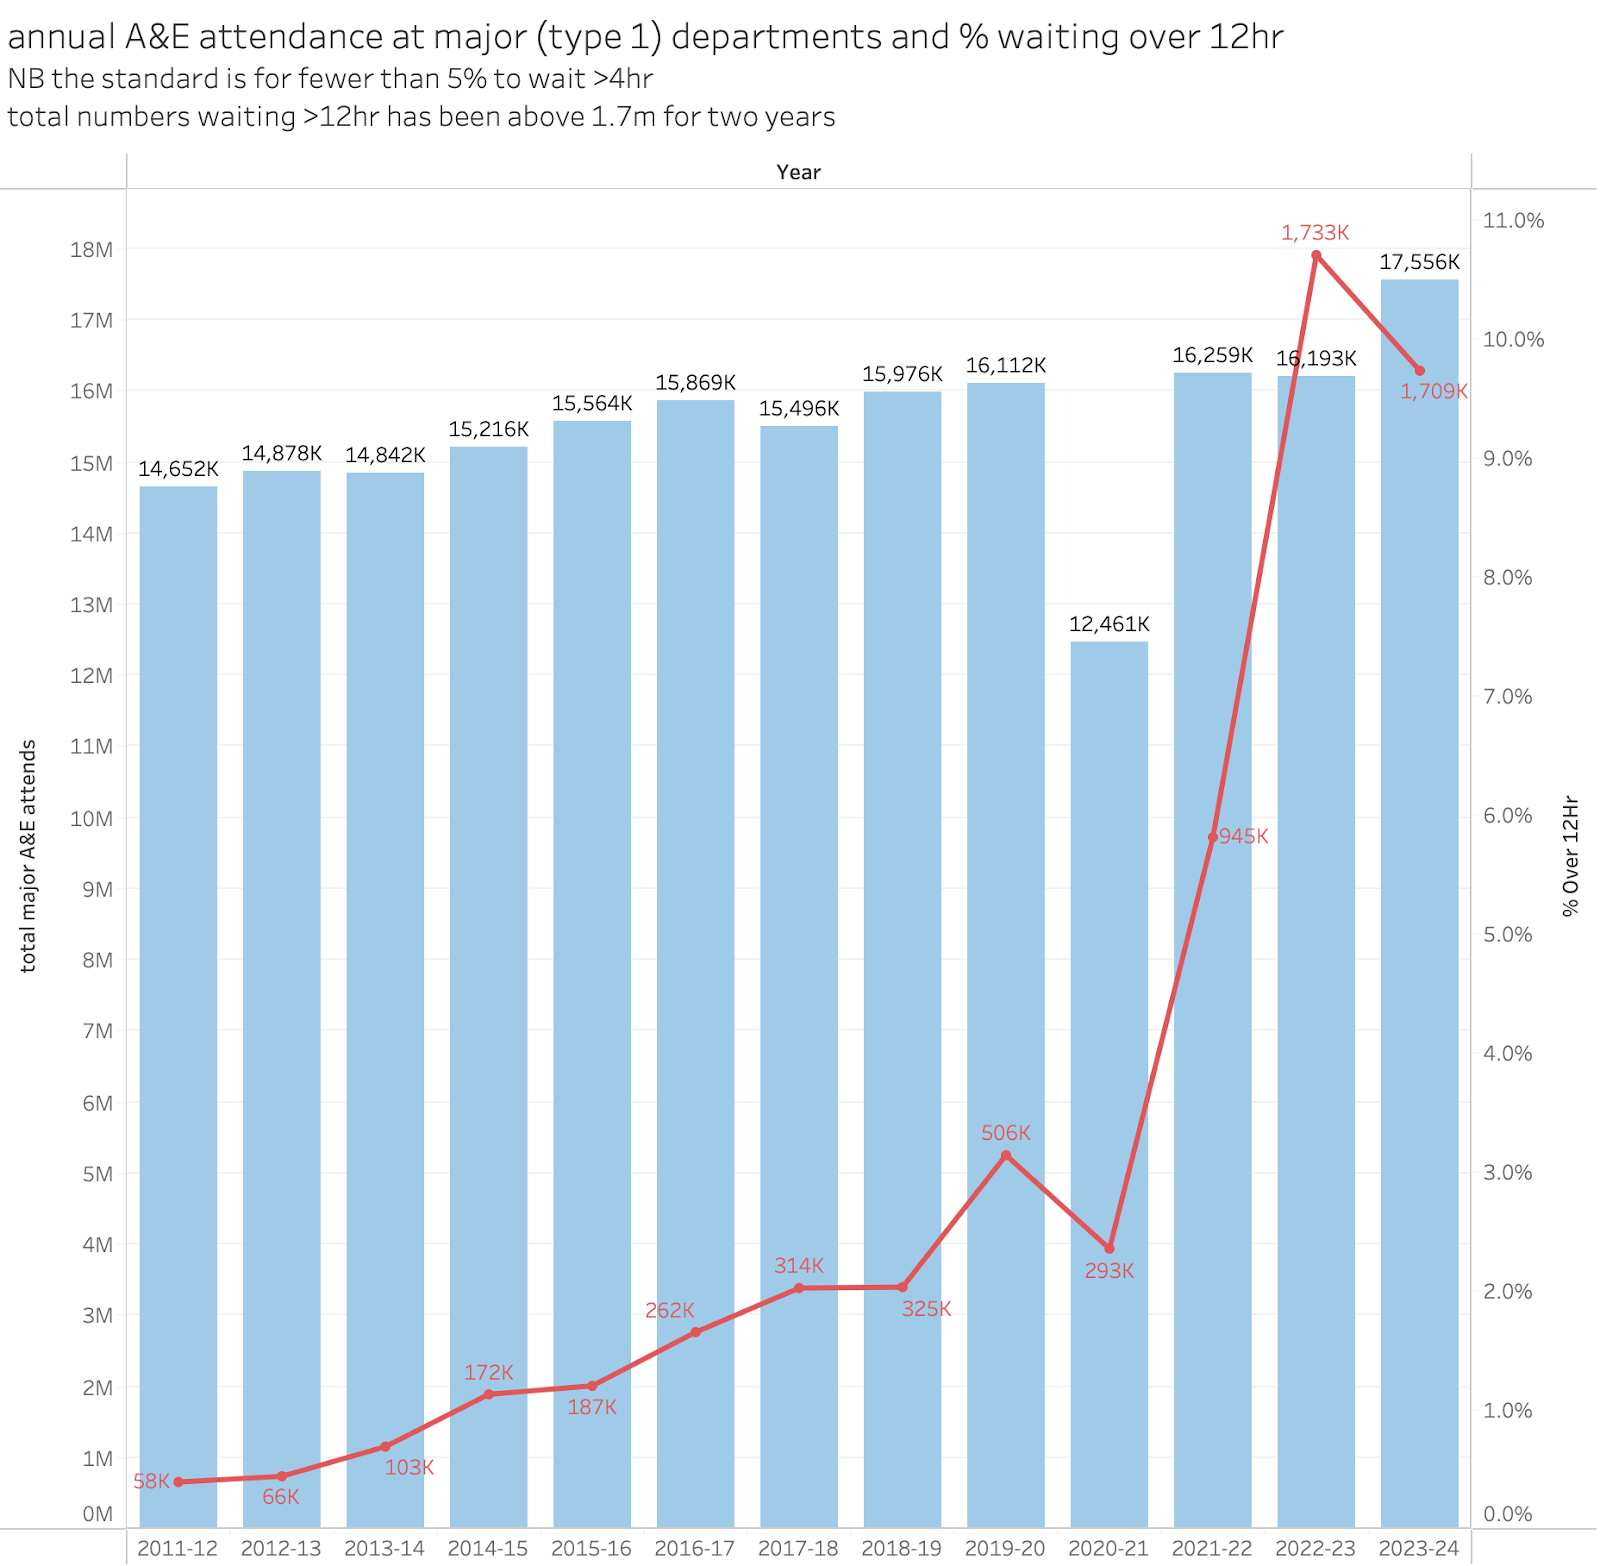
For context, in case this was not clear, in 2022/23 about 11% of all arrivals waited more than 12hr to leave the A&E. The target is for fewer than 5% to wait more than 4hr.
NHSE resisted publishing more details of 12hr waits for a long time. They didn’t relent until last year when monthly 12hr totals were included in the monthly performance numbers.
Knowing the annual total 12hr waits gives at least some basis for starting to estimate excess deaths from long waits. And the initial RCEM estimates were based on applying the EMJ mortality rates to the annual 12hr totals.
That’s what the RCEM used. They assumed–as most experts assumed–that most 12hr waits were for admitted patients so the EMJ NNH number for 8-12hr waits could be used as a conservative estimate of the excess deaths for 12hr waits. Since the mortality estimated by the EMJ work increases every hour waited, this should give a conservative estimate of mortality rate for the group waiting >12hr. Their 2023 estimate was that between 300 and 500 extra deaths occurred every week from long waits.
Independent actuaries and statisticians have cast their expert eyes over these numbers and found them plausible. This Full Fact analysis from January 2023 has a good summary of their opinions of the original claim.
In 2024 they FOI’d the system for better data. It turned out that the assumption that most 12hr waits were for admitted patients were false, about 30% are discharged after their 12hr wait. The EMJ didn’t estimate the mortality for discharged patients so they excluded them to get a more reliable excess death estimate for the group waiting >12hr for admission. This still left a shocking but slightly lower estimate of an average of 250 deaths per week caused by long waits.
But note the conservatism of this estimate. It applies a mortality rate for the 8-12hr wait group to the >12hr wait group even though there is good reason to think it should be higher mortality for those longer waits. And it ignores any mortality for discharged patients not because there isn't likely to be any but because the EMJ paper didn’t estimate it.
A similar FOI done about the same time as the RCEM one shed some further light on this and allows a different estimate. This is from an FOI by The Independent:
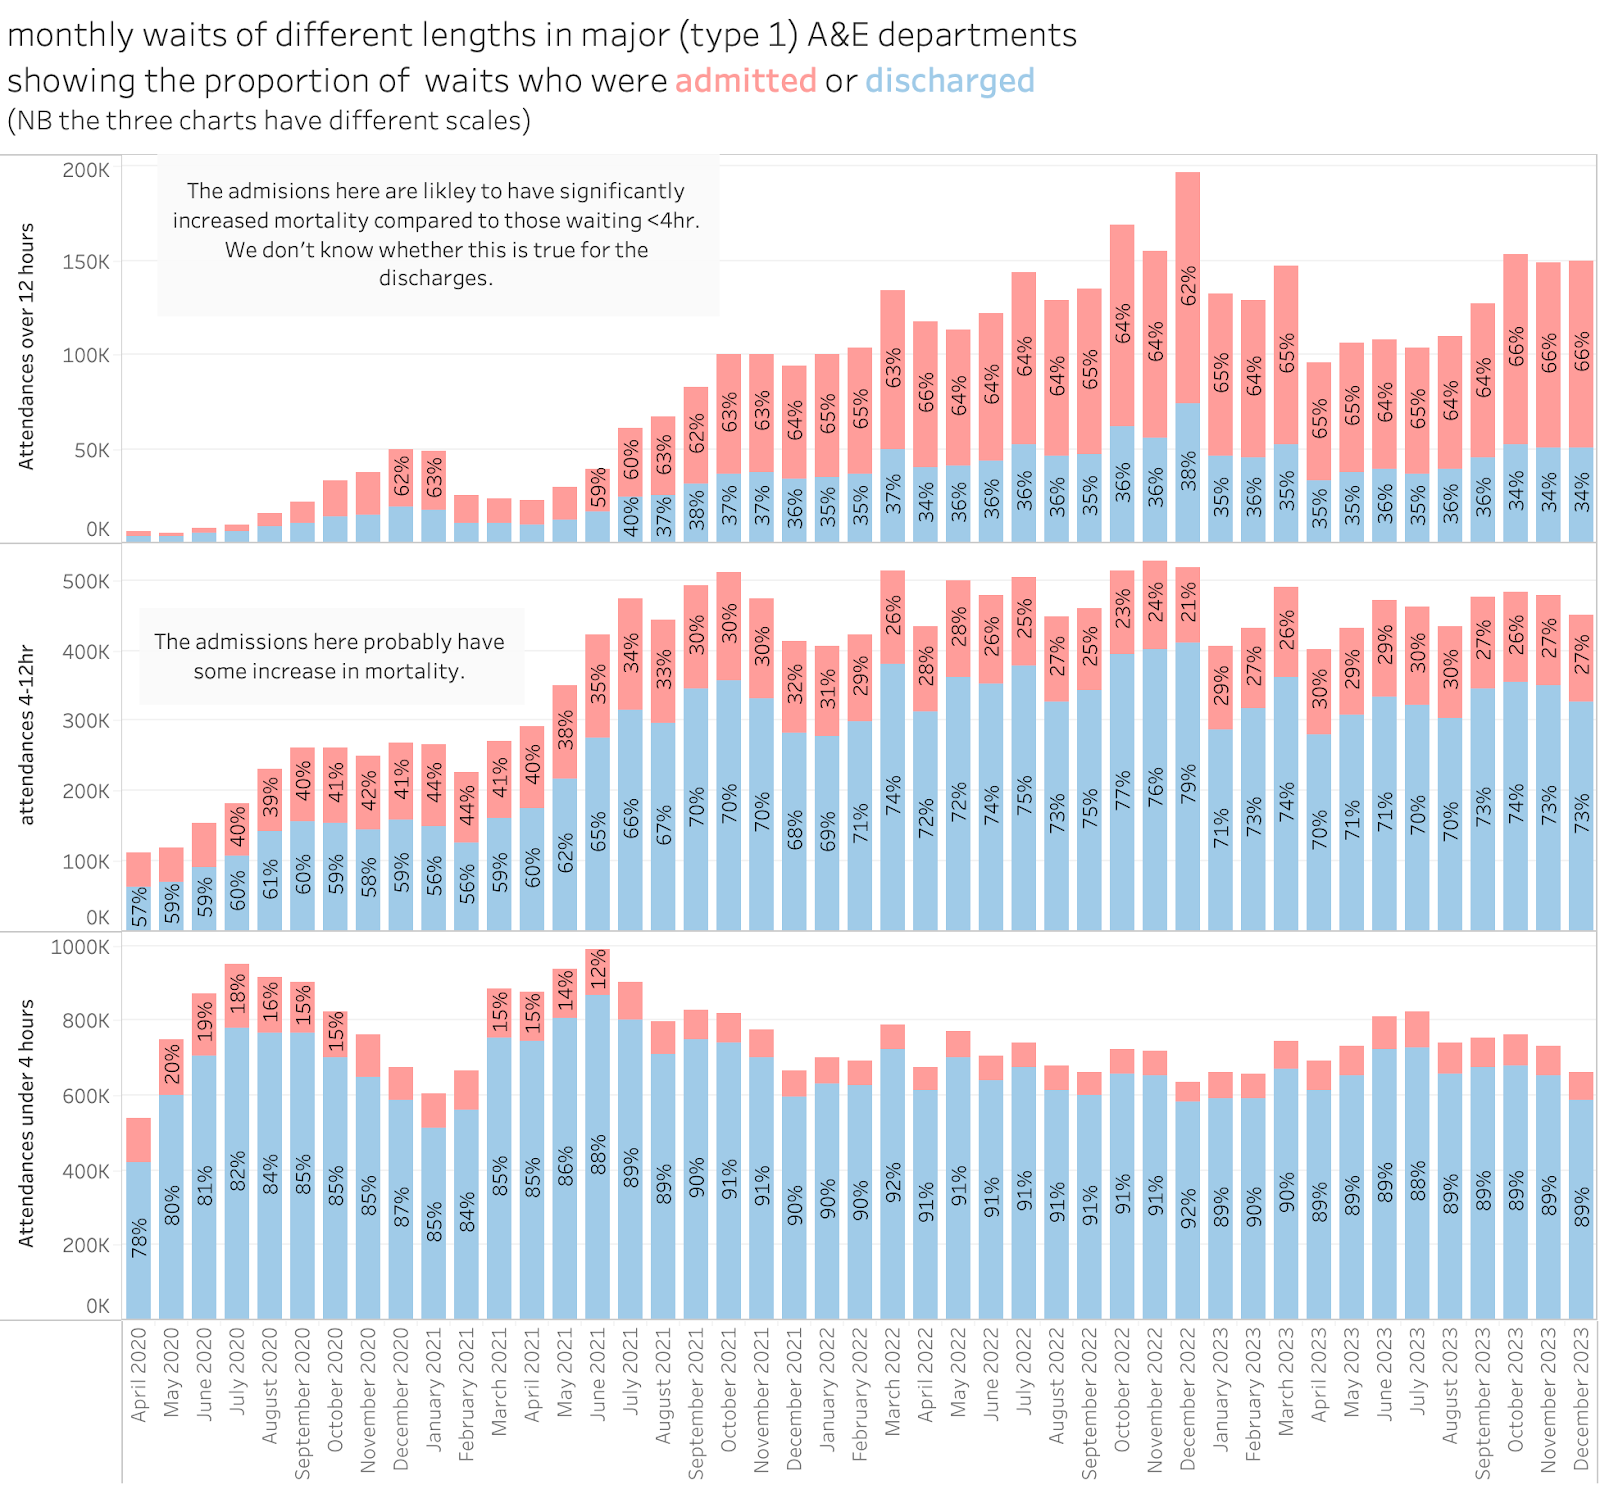
We can see in this the total attends based in different waiting times but also classified by whether the patient was admitted or not. The RCEM were right, only ⅔ of 12hr waits are admitted. But we also have the number of waits longer than 4hr and under 12hr (where slightly less than 30% are admitted). But this allows an additional excess deaths estimate based on the below 12hr waits. Even if we take the lowest mortality band from the EMJ study (NNH is 191 for waits between 4 and 6 hr) this suggests an extra 150 deaths per week.
An additional comment is worth making. It is downright astonishing that so many patients wait 12hr only to be discharged. This alone should be a major indicator of an appalling level of dysfunction in our A&E departments.
The implications of the numbers and the NHSE response
If hundreds of deaths a week are occurring because patients are waiting too long to leave A&E that is surely one of the most significant and important problems for the NHS.
But the leadership in NHSE “don’t recognise the numbers”. And claim that it is the job of the ONS to calculate excess deaths. NHSE said this to full fact (see the above link, highlights are mine):
“When asked on the BBC if he accepted that A&E delays have caused deaths, Professor Stephen Powis, National Medical Director of NHSE, said “it’s not unusual to see high levels of excess deaths in the winter”.
When pushed to give an NHSE estimate of deaths due to delays in A&E he said it is “very difficult to say'” but that it was “not for us at [NHSE] to produce those figures, [it’s] for the ONS and others to look into”.
However an ONS spokesperson told us: “We are not able to produce any analysis on deaths that are due to A&E delays. Our statistics are based on death registrations, so we analyse deaths (excess deaths in this case) based on information collected on the cause of death from the death registration.”
NHSE’s Chief Strategy Officer Chris Hopson also previously told the Today programme “a full and detailed look at the evidence…is now under way”, but we don’t have any further details of that work, or even know who is doing it.
In the press release to the march 2024 revision of the RCEM claims those responses were broadly repeated.
But the statement by the ONS undermines the diversionary claim by NHSE that “excess deaths” is what the ONS do. But the ONS excess deaths analysis is unrelated to the EMJ analysis. The specific calculation of the relationship between waiting times and mortality requires NHS data the ONS doesn’t routinely analyse. But the same claim that this was the ONS’s job was repeated 15 months after the ONS denied it. Chris Hopson’s claim that “a full and detailed look at the evidence…is now under way” would be a welcome development but no evidence has emerged in 15 months that this is happening.
This is particularly frustrating as NHSE’s own analysts are the only people who have access to all the data to repeat the EMJ analysis. If a competent analyst were asked to take a quick look at the data, they would have a quick approximate estimate of the credibility of the EMJ analysis within a week. Better than that, they could extend the analysis to include discharged patients which the EMJ analysis ignored. And they could use all the data since 2018 and update the estimates to test whether the problem was getting better or worse over time.
If the EMJ analysis lacks credibility or is downright wrong, NHSE could show why quickly by repeating the analysis themselves. There are several possible reasons why they have not done this. One is that the leadership doesn't understand just how easy it would be for their own analysts to do it. That is disturbingly plausible. But they could call any of the EMJ authors and ask. But, as far as I know, none of them have been contacted by NHSE. Another is that they are showing wilful blindness to the severity of the crisis in A&E. The worst explanation is that they have looked at the evidence and things are even worse than the EMJ estimated and they really don’t want to admit that.
The important issue is that while some other organisations could repeat the EMJ analysis (though more slowly and with older data) NHSE are the only organisation who could do a thorough job on up to date data. Despite a promise to “look into” the evidence made in january 2023, there is no evidence this has been done.
The importance of the results (statistics are a lot less compelling than single patient anecdotes)
The death of one man is a tragedy. The death of millions is a statistic. (falsely attributed to Stalin, actually a paraphrase of earlier work by Kurt Tucholsky).
The influence of media stories about bad things happening in the NHS is dominated by personal anecdotes. They work well in headlines and writing because they provide that personal link that strokes the strings of empathy. The handful of deaths caused by nurse Ruth Letby are given outsized impact because the media can report the personal stories from the families and staff. Even the scandal of Mid Staffordshire (potential deaths caused by poor practice estimated anywhere between hardly any and a thousand) are far more salient in the public mind because of the personal stories from some of the victims and their families.
But this distorts the perception of where big problems are. There are no such stories about the hundreds of excess deaths every week in A&E. At most we get stories about how awful it is to be stuck on a trolley for 12 hours. But we can’t identify the individuals who died early because of long waits as the weekly totals are merely statistics and it is impossible to separate the 8% of admissions who would have died with a 4hr wait from the extra 2% who died because of a long wait.
The huge scale of the problem is a statistic and the media don’t treat it as a tragedy.
So, a lack of compelling personal anecdotes leaves public discussion of NHS problems deeply unbalanced. The NHSE leadership can’t use this as an excuse. They have a duty to understand which problems are biggest and the measure for that is the statistics not the anecdotes or the number of bad news stories in the media. If they don’t recognise the scale of the problem, they won’t devote the right amount of focussed effort to fix it.
Even conservative estimates of the excess deaths associated with long waits have them at 20k per year. That’s way more than the total number of deaths estimated from the scandalous NHS contaminated blood scandal. It is the same scale as the total estimated deaths from heart attacks caused by Merck’s Vioxx (rofecoxib) painkiller which forced them to withdraw the widely used drug.
But NHSE continues to deny the statistics. And, while the media in general have discussed it, it has not received anything like the emphasis as the stories containing personal anecdotes.
What should NHSE do?
To me there are a handful of key actions that are necessary:
Immediately stop trying to deflect from the issue with weak excuses or spurious arguments.
Repeat the EMJ study using the more recent data that NHSE have unique access to. Do it for recent data and for the 7 or so years of old data that would also cover the initial EMJ study. Also assess whether discharged patients see elevated mortality.
Be open with the results so independent experts can either refute the EMJ claims or refine the claims.
If the EMJ results hold up, immediately rethink the priorities for where action is most urgently needed to improve the NHS and adopt a much tighter focus until the biggest problem is fixed.
According to an old Mark Twain pun, Denial isn’t just a river in Egypt. The NHS can’t afford an NHSE that is taking a whole riverboat cruise there.