The NHS needs to redesign the metrics it uses for A&E performance
Getting patients through A&E in 4hr is a good goal which the NHS once achieved for the best part of a decade.. But the way this performance is calculated is a mess that needs serious revision if the system is ever going to achieve it again.
NHS performance data dump day happened early february and we got the numbers for performance up to january. They were mostly bad but we have become so attuned to bad performance they didn’t raise many eyebrows. And the combined panglossian might of the DH and NHSE press offices will undoubtedly manage to squeeze some positive messages from the detail.
We should ignore anything the press offices say. Not least because they will all be the first against the wall when the revolution comes.
And, apparently, NHSE are trying to get ministerial sign off for a new interim target for A&E performance to drive improvement. But the new target is to get 77% of patients out within 4hr, just 1% more than the current–shockingly unambitious–target of 76%.
They should be far more ambitious. And ministers should insist that the targets are redesigned as the current ones are as useful as the Fukushima nuclear power plant after the tsunami.
Here are some back of the envelope observations from the January numbers that show why major changes are needed.
The 4hr target and its problems
There isn’t anything fundamentally wrong with the 4hr target, despite what some anti-target thinkers claim. When it was first introduced many claimed it was purely an arbitrary management target and would distort clinical decisions. But this has been studied and it wasn’t true. Setting and enforcing the standard led to huge improvement.
Getting through an A&E quickly is good for the patient. And the original intent was to set a simple standard that would eliminate particularly dangerous long waits. The intuition behind this was good and we now have a great deal of evidence that long waits kill. In the biggest UK study mortality starts to be measurably larger with waits over 5hr and keeps rising with longer waits (for admitted patients). Other studies elsewhere see the same effect for discharged patients.
And, since >98% of patients did leave A&E in <4hr from 2005 to 2010 with far fewer A&E staff than the current levels, we have good evidence the target is achievable.
But the problem with the current way the target is calculated arises because of two factors: current achievement is very poor and there are now different types of “A&E” that don’t work the same way and have very different performance.
Type 3 A&E units take about 30% of the total volume and have grown a lot in the last 15 years (some are called walk in centres (WICs), others minor injury units (MIUs) and urgent care centres (UCCs)). They don’t open 24hr a day and can’t handle major injuries or some specialist services. But, most importantly, they don’t usually have problems meeting the 4hr target and have very little impact on major A&Es unless they are co-located.
But the metric for A&E performance includes their performance even when the units have no meaningful relationship to the major A&E their performance is attributed to. When everyone’s performance is good, this doesn’t matter as the headline metric will clearly signal where there is a performance problem. But now that major A&Es often have performance below 50%, including UCC numbers create a huge opportunity for gaming and dilutes the signal identifying where the problems are.
Worse, they are not distributed evenly. Some hospitals have no attributable type 3 units; others have large numbers of them. This creates both inconsistency and an opportunity to game the headline number. In some cases hospitals have sought dodgy legal routes to “claim” control of type 3 units in order to hide how bad their persistently bad major A&E is.
To see how prevalent this is look at this chart based on January 2024 numbers.
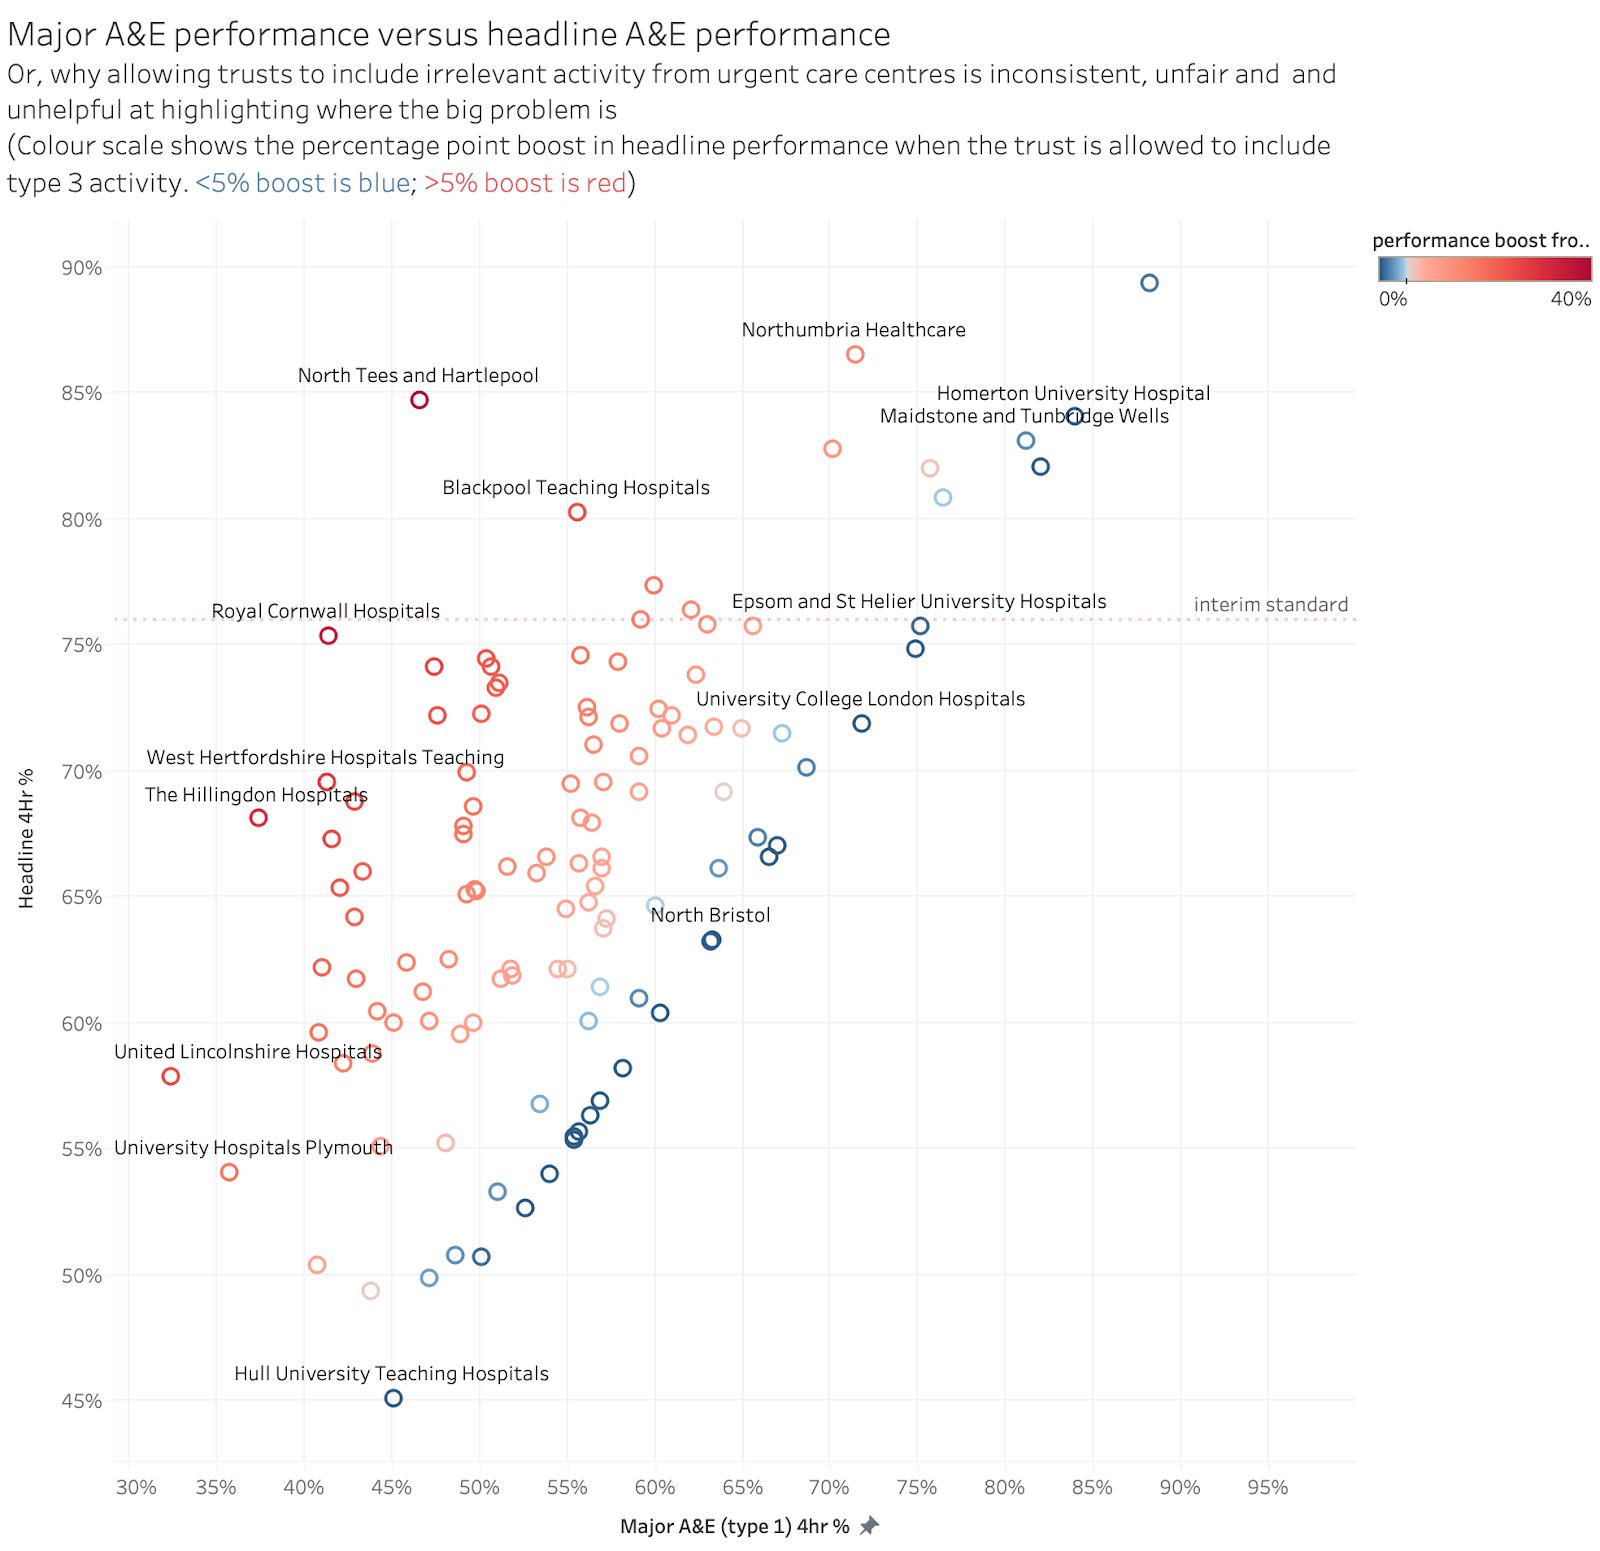
The Royal Cornwall’s major A&E had a performance of just 41% but their headline performance nearly met the interim national standard once their (unrelated) type 3 performance ws included.
All the trusts in red are getting at least a 5 percentage point boost to their headline performance by including type 3 activity. IF their major A&Es were performing in the 90%s this would barely matter but only 3 trusts with big headline boosts are doing better than 65% on the major A&E performance. At those levels of performance, including type 3 activity gives a huge and unjustified boost to their headline number. For trusts in blue, the headline metric is a good approximation of their major A&E performance.
Another way of viewing this data is shown below in a chart that ranks how many points trusts headline performance is boosted by including type 3 activity:

It is hard to take a metric seriously when the headline numbers see so much adjustment from factors unrelated to the core point of having a target.
The solution is fairly simple. If we are trying to drive improvement, the reported metric should be for individual units and type 3 units should be kept separate from major type 1 units. (there is a slight complication in that, if the type 3 is co-located with a major A&E, they should probably be grouped together and this would affect some of the numbers above, but this isn’t that common).
The performance problems are essentially all in type 1 units so a metric that focuses on only their performance should be used to identify and drive improvement. (Caveat: some clarification of definitions may be needed as well as some of the above numbers may include co-located type 3 units that should really be counted as part of the major A&E).
The problem of 12hr waits
There is another problem with using the 4hr metric to drive improvement. In its original formulation meeting the 4hr target virtually eliminated the possibility of very long waits. That is no longer true. If the standard time was set at 12hr not 4hr we would still be a long way from meeting it. Not only is the current NHS failing to get 95% of patients through A&E in 4hr, it isn’t even getting 90% through in 12hr. So driving improvement purely by looking at 4hr can miss the need to eliminate very long waits.
We have some evidence that 12hr waits continue to rise significantly while marginal improvements occur in the 4hr standard. This might suggest that some trusts are putting effort into the 4hr standard while neglecting patients who have missed it leaving them with very long waits. That is very much missing the point while pursuing the target.
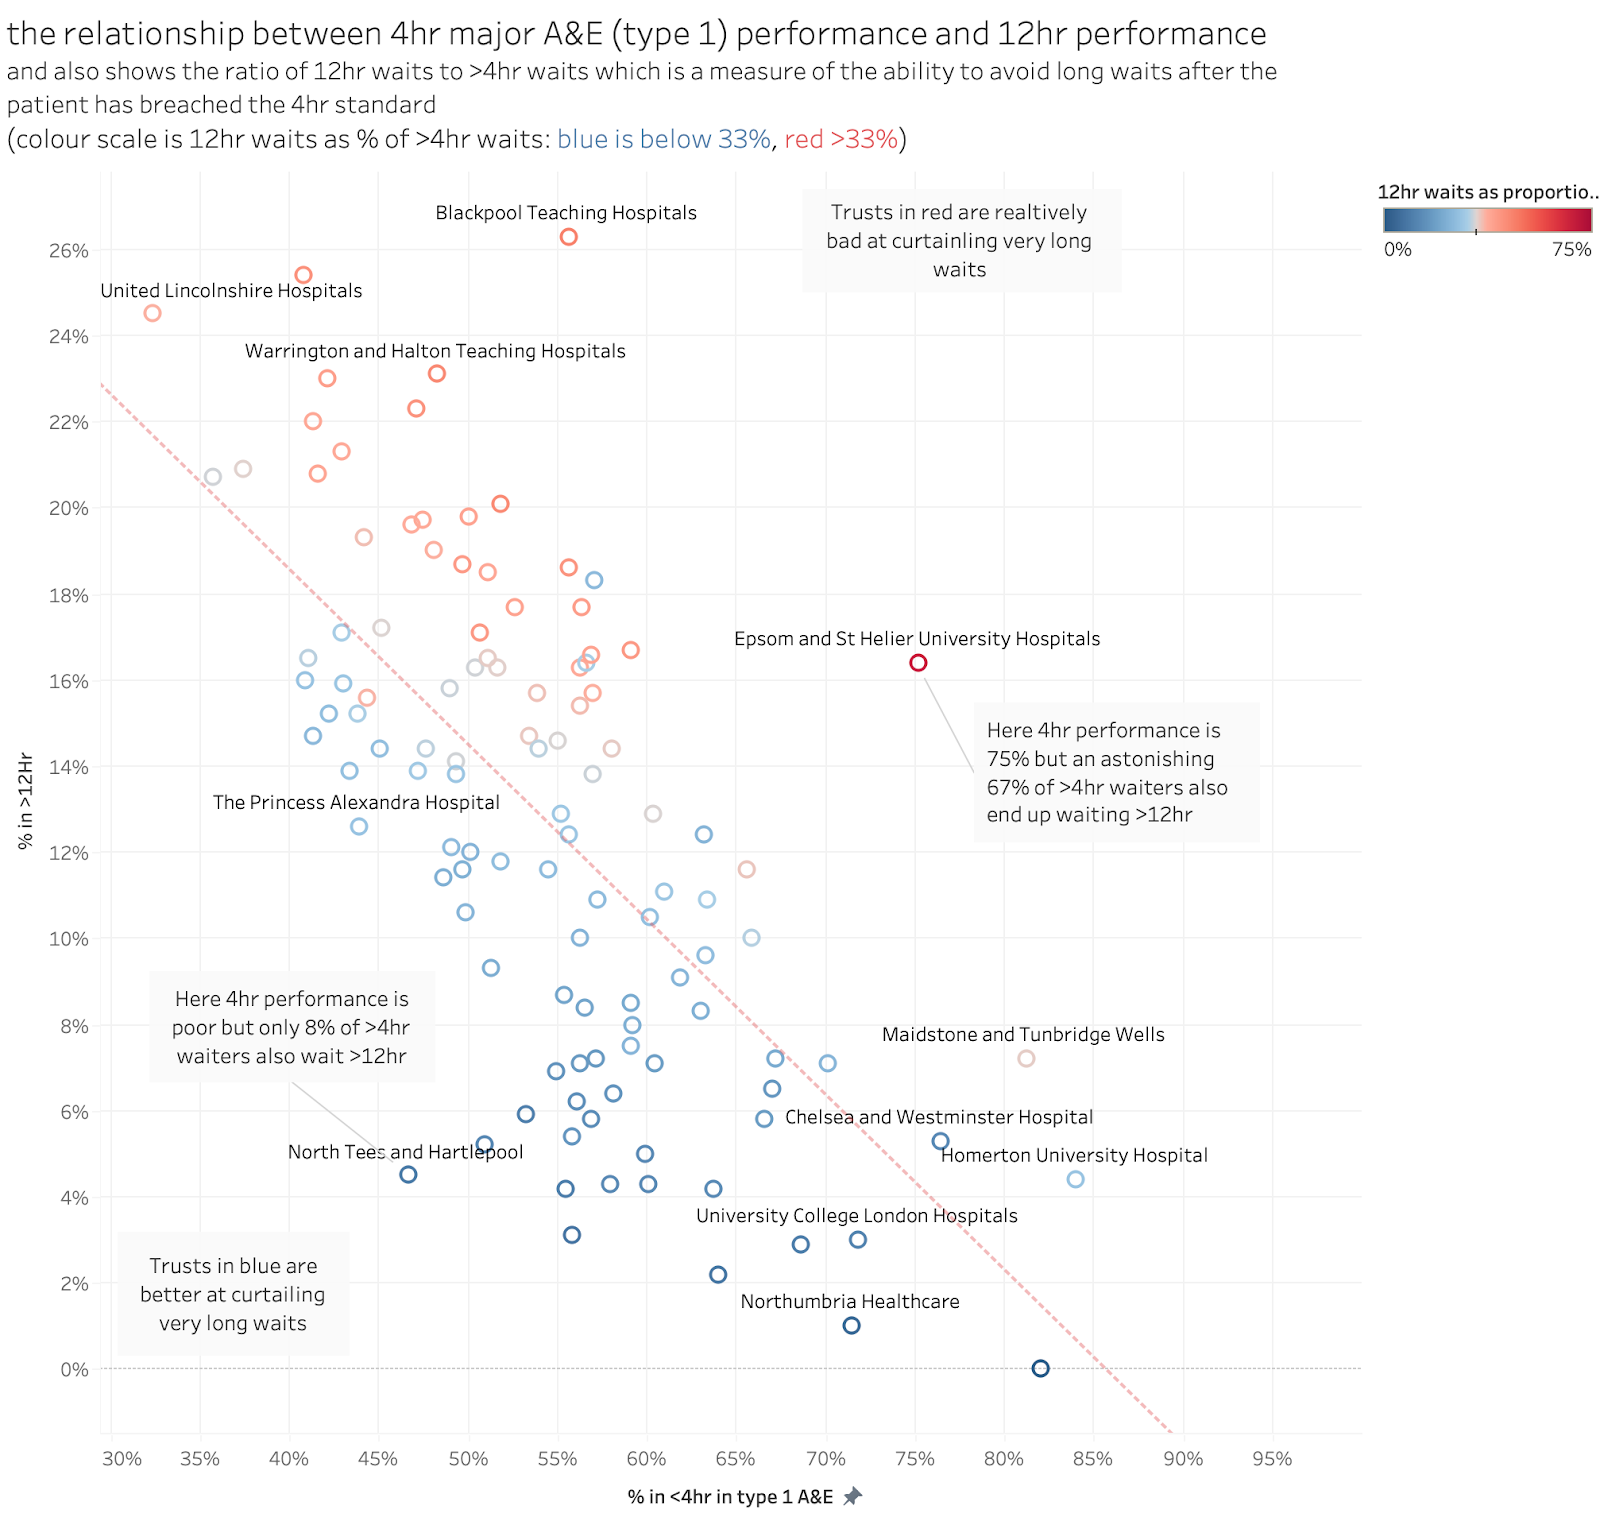
While the 12hr performance is broadly related to the 4hr performance the detail suggests that some trusts are much worse at curtailing very long waits. This chart shows the overall relationship with an extra twist: it also analyses the proportion of >4hr waits that also wait >12hr (nationally about one third of 4hr breaches end up waiting >12hr but this ratio varies a lot).
So, instead of trying to set an interim target for 4hr performance it might be far more effective to start with a focus on those very long waits. Set and enforce a target for 12hr waits as the interim metric and return to 4hr only when 12hr waits have been eliminated.
This will cause a problem for NHSE who have resisted publishing honest 12hr waits for nearly a decade (they were only forced to do so in feb 2023 because the minister insisted on it). But, given the scale of excess mortality from those long waits (which is probably in excess of 2k patients per month) this should be a major priority.
The problem of the 12hr wait after DTA metric
NHSE might object to using 12hr waits from arrival on the grounds that it already has a 12hr metric which has a long publication history. This is the longstanding 12hr wait after a decision to admit (commonly called the “trolley wait” target.)
But this metric is unreliable and gameable. This has long been known. The intent of the metric is to focus attention on long waits for admitted patients caused by delays finding a bed. The problem is that the decision to admit (DTA) is entirely gameable. Hospitals can delay the DTA if beds are scarce minimising the number of reported delays. Many patients have already waited 8-12hr by the time a DTA is made so the reported numbers seriously misrepresent long waits. The 12hr from arrival metric is, in contrast, not gameable. Historically we don’t have monthly data to compare both metrics. But annual numbers are published and the real 12hr waits have been more than 100 times higher than the 12hr DTA count. As overall performance has collapsed, that ratio has fallen and is now between 3 and 4.
The analysis below shows the relationship at trust level between the 12hr after DTA metric and the 12hr from arrival metric. Note the variation across trusts and the fact that some trusts with a large number of 12hr from arrival waits have almost no 12hr from DTA waits.
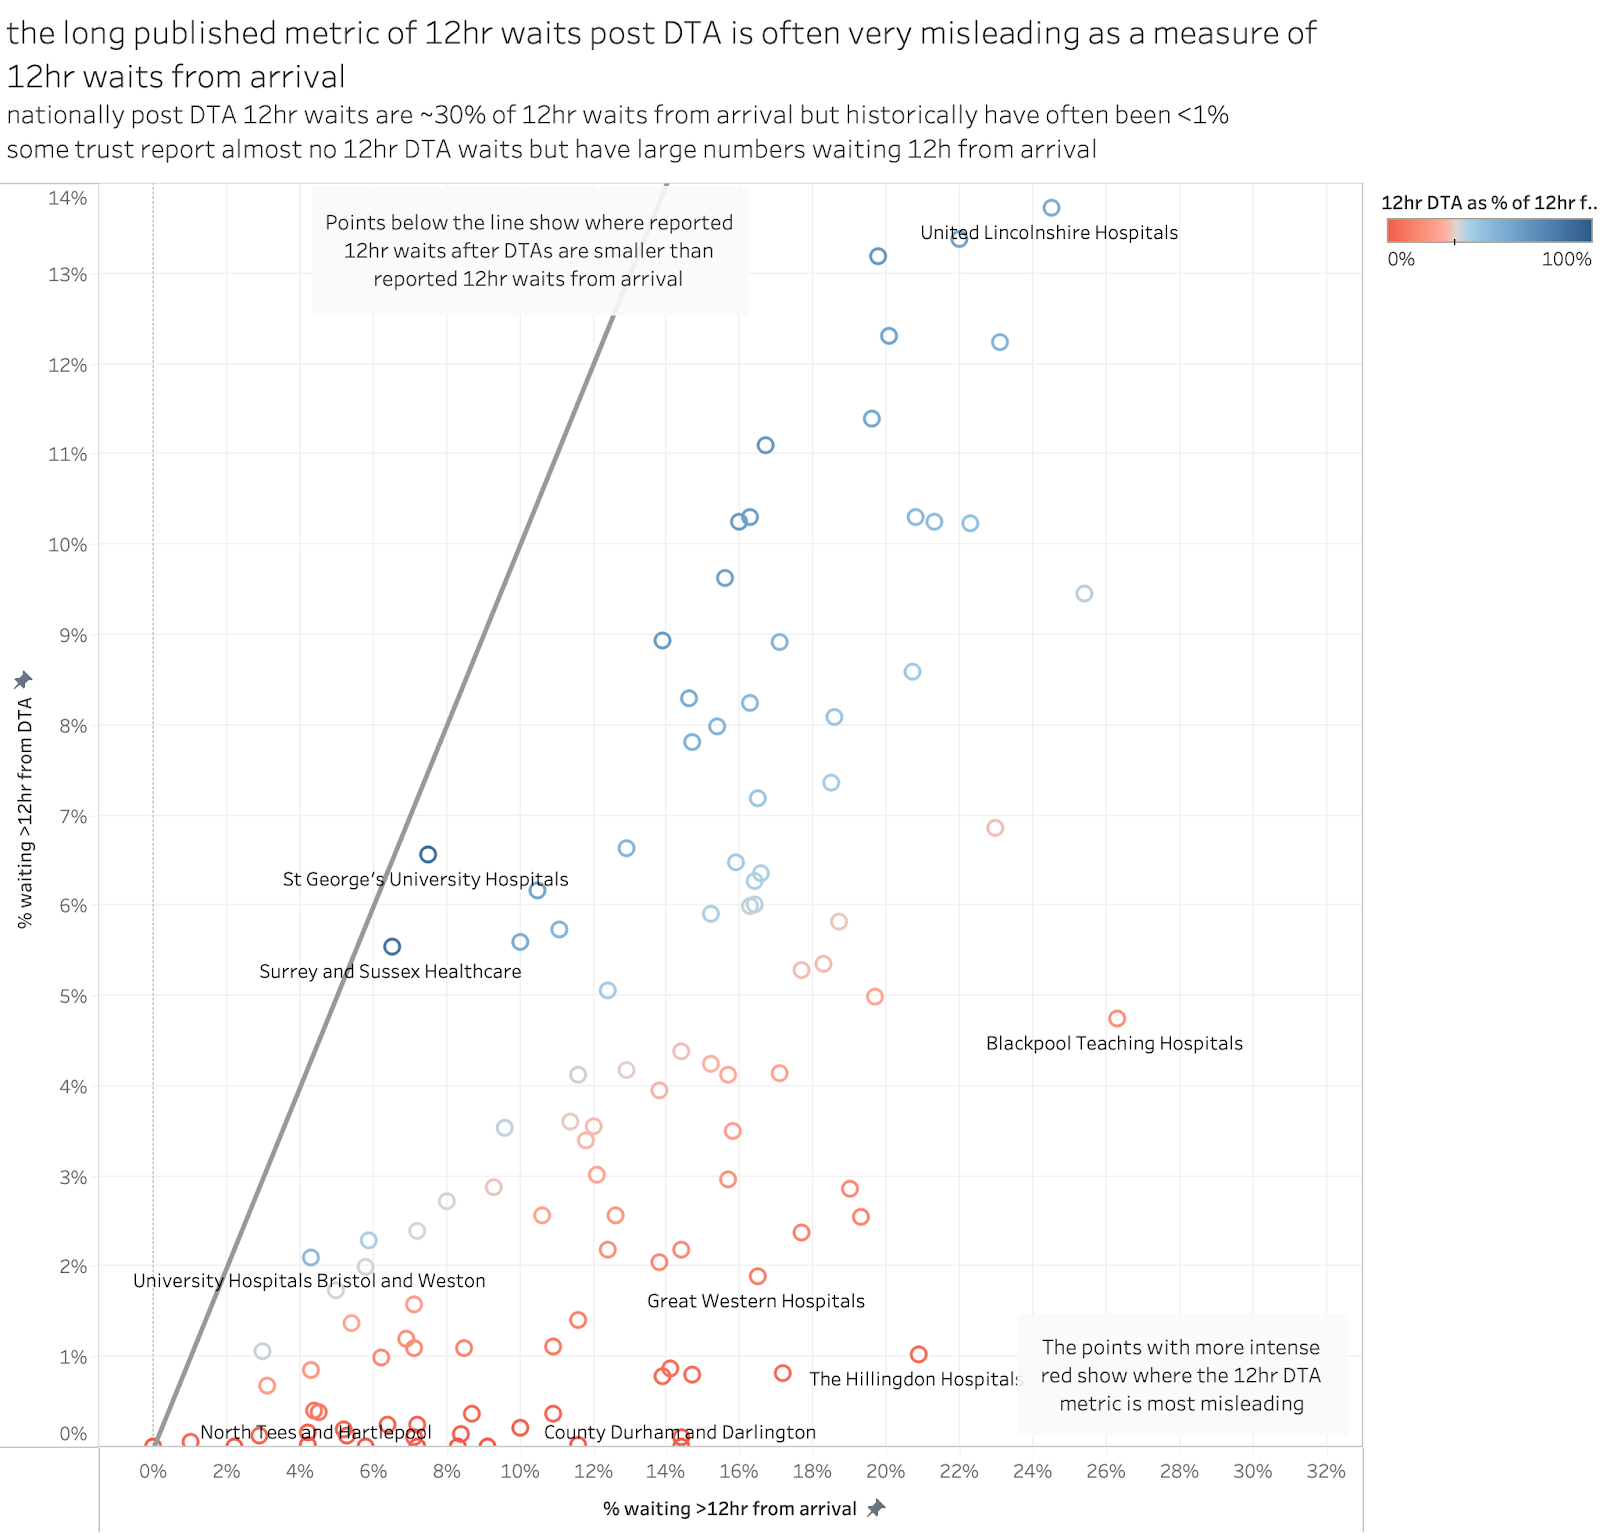
The DTA metric is unreliable and should be replaced with the far more reliable 12hr from arrival metric.
Conclusions
There is a huge problem in how NHSE have tried to improve A&E performance and the metrics they have used is only a part of the problem. NHSE strategy was entirely focussed on the wrong causes of poor performance for a decade. And, even though the current UEC strategy (published in January 2023) admitted that mistake, NHSE still seem bereft of focus on the underlying operational problems causing poor performance. And their process improvement methods seem ricketty with little grip and few incentives to drive improvement.
But the whole process of driving improvement–even if it were effective–would be undermined by metrics that fail to correctly identify where performance is poor. Better metrics won’t fix the performance, but at least they could stop actively undermining the process.
[added after original posting] PS One additional problem I forgot to mention in the first draft of this is that the current data is reported at Trust, not site, level. Many trusts run multiple type 1 A&Es but there is no public data on the site-level performance despite many trust haveing sites with very different performance. It would be good for both the public and the internal ability of the system to understand performance differences if all reporting was changed to be site, not trust, specific. The argument for not doing this is that trusts are the legally responsible body for performance. I'd say, screw the legal niceties, we need the better, more specific, data to get a grip on performance and to be honest with the public.]