Pages

Showing posts with label prescribing. Show all posts

Monday, 27 June 2022

What the hell is happening with hospital prescribing?


[Update: I need to issue an important caveat about the analysis in this post. When published, I had just been made aware of new and very detailed data sources about hospital prescribing, monthly sources with detailed analysis of volume and indicative price. The analysis was based on those sources and was consistent with a longstanding NHS Digital annual report on the total cost of hospital prescribing. But when the analysis attracted some attention, it was pointed out that the indicative pricing data was highly unreliable because of commercially sensitive discounts that were missed in the public data (including the NHS Digital totals that had been available for about a decade). Some new sources (though they are very, very hard to find, have the (apparently) correct total spend but not the detailed monthly detail on individual drugs).


So any total spend numbers in this analysis may be large overestimates, though volume and price trends are probably correct.


But the situation is a complete clusterfuck as the NHS has been publishing badly incorrect data on total spend for more than a decade. And we still do not have any reliable way to analyse where the hospital drug budget is going or test its value for money. But it is important to be aware of the possible errors when reading the conclusions. Though many are still valid. Which is why I am leaving this analysis here in the hope that our ability to analyse an important chunk of NHS spending will improve in the future.]


According to the data we have, hospital prescribing is one of the fastest growing areas of NHS spend. Until recently, the only public data we had was the total spend. In the last three years new sources on what is happening with much more detail have become available. In the last year this has included data about spend. So we can start to understand some details about what is happening. This is a preliminary analysis.


It is not, though, a thorough analysis. It can't be, as the availability of data is poor and quality of data is partly suspect. Some have questioned whether the financial data is reliable. I can't judge that, but, even if it is not accurate, the overall story is worrying as a major shift in NHS spending has happened without much scrutiny or deliberation.


My hope is that a quick and dirty analysis for this new data can kick off a debate and incentivise further work. It is clearly an area of NHS activity that deserves far more attention.


Primary care prescribing is a well-scrutinized area of NHS spending. It is controlled by GPs and costs the NHS about the same as all the payments made for all GP activity. Prescribing has cost the NHS about £9bn/yr for most of the last decade. And we know a great deal about it as the monthly data about all the prescriptions issued by GPs has been publicly available since 2010. So I can tell how many doses of 40mg simvastatin were prescribed by my GP in january 2011 and how much that cost the NHS.


We don't know the same for what hospitals do. Until recently, all we had was the total spend as published by NHS Digital here: https://digital.nhs.uk/data-and-information/publications/statistical/prescribing-costs-in-hospitals-and-the-community/2019-2020 . This dataset (which also contains the total spend in primary care) looks like this:


The GP prescribing spend is uncontroversial; the hospital spend total has been questioned when I have mentioned it on social media by some but the growth rate has not. If the NHS digital numbers can be trusted, this is a huge shift in NHS spending that has gone without much, if any, scrutiny. A simple projection of the 2019/20 total at the average growth rate suggests that the 2022/23 total will be about £17.5bn whis is both four times bigger than it was in 2010/11 and about the same as the total spend on both GPs and the drugs they prescribe. Or close to 10% of all NHS spend in England.


A large budget growing at 15% a year in an NHS where the overall budget is barely growing should be a significant concern for the system. Some might, rightly, ask what NHSE have cut to enable this rapidly increasing spend (note that all the numbers above are before the pandemic hit and before the government promised lots of extra money for NHS reform).


Historically there has been little analysis of this total because the data was provided to NHSE by IQVIA whose contract limited the detail available (possibly because IQVIA collected it to sell it on to pharma firms to help their efforts to market their products to hospitals).


Ben Goldacre and Brian Mackenna argued forcefully in the BMJ in 2020 that there were few excuses for not getting better information from hospitals and major benefits for doing so.


It is worth quoting some of their arguments (any emphasis is mine).


"...there is little publicly accessible data on what is prescribed and dispensed in each hospital. This effectively blocks work to identify variation and signals indicative of suboptimal care."


"...there are no technical barriers: data is currently extracted, aggregated, and normalised into one national dataset through at least two systems. Access to this data, however, is limited by a complex network of commercial contracts, apparent resistance to transparency at some NHS trusts, and historical reluctance to make change at a policy level.."


"Restricted access presents multiple problems. Firstly, it prevents analytic work by teams with the skills and creativity needed to generate actionable insights for diverse groups of users. A recent survey reported data access as a key barrier preventing early career NHS pharmacists using data to inform practice"


"Secondly, closed working models also create barriers to verification, critical review, and collaborative improvement of analytic work."


"Thirdly, restrictions around data sharing impede innovative approaches to improving quality, safety, and cost effectiveness using medicines data. Independent researchers working on primary care prescribing data have identified whole new categories of cost savings, novel informatics methods, and research on the reasons for slow and rapid uptake of evidence in clinical practice. Hospitals are where new treatments are most likely to be used and where costs are growing fastest; they are therefore where this kind of collaborative analysis is most needed, but it is currently prevented by data access barriers."


"Lastly, data access barriers prevent public and independent external scrutiny of hospital activity. Although publicly accessible data can be uncomfortable for organisations and requires thoughtful handling, thoughtful public scrutiny on public services can help build better quality, safer, and more cost effective care."


This article appeared to have an effect on the leadership who released a monthly datasource which starts in 2019. The new source contains volume data about every item used in hospitals and has recently been supplemented by information on the price paid for those items. The volume data is accessible here and the more recent data with indicative prices is here. Thanks to the team at openprescribing.net for pointing out these recent releases when I complained about the lack of good data on hospital prescribing.


What are the issues with the new data source?


There are several issues with the new hospital prescribing data source. Perhaps the biggest is that few organizations with the capacity to analyze it have had any time to do so. Even the team at opneprescibing.net who have done such a good job with primary care data.


Another big issue is that there is no coherent metadata to classify the drugs (primary care drugs can be grouped in a hierarchical classification based on the BNF which groups similar drugs for similar conditions together). This makes analysis harder. Another issue is that the prices are, again unlike the primary care data, "indicative" rather than actual (more on this later). 


We can overcome some of the problems of not having a classification by looking at the generic names of the drugs which often contain big clues about the type of drug. Also, we can look the specific drugs up in formularies to work out what they are for. But there are about 12k unique names in the list of prescribed items and about 3k different names if you strip out the different formulations of the same drug (these are crude estimates based on some simple text parsing as, franky, who has the time to manually classify 12k bloody text strings). Luckily, many of the important classes of drugs (with large volumes or costs) are easy to identify. Modern biologic drugs for treating haemophillia, for example, all end in "cog"; monoclonal antibodies (a very expensive class of biologics used in cancer and some immune diseases) all end in "mab". So a quick and dirty classification is possible that highlights some of the key trends.


Applying this simple classification also reveals some detailed issues with the data. Those "cog" drugs, for example, show some data issues. Normally the monthly spend on the groups is £5-10m but between march and august 2021 that leapt to between £200m and £800m per month but fell back to ~£10m in later months. See this chart:
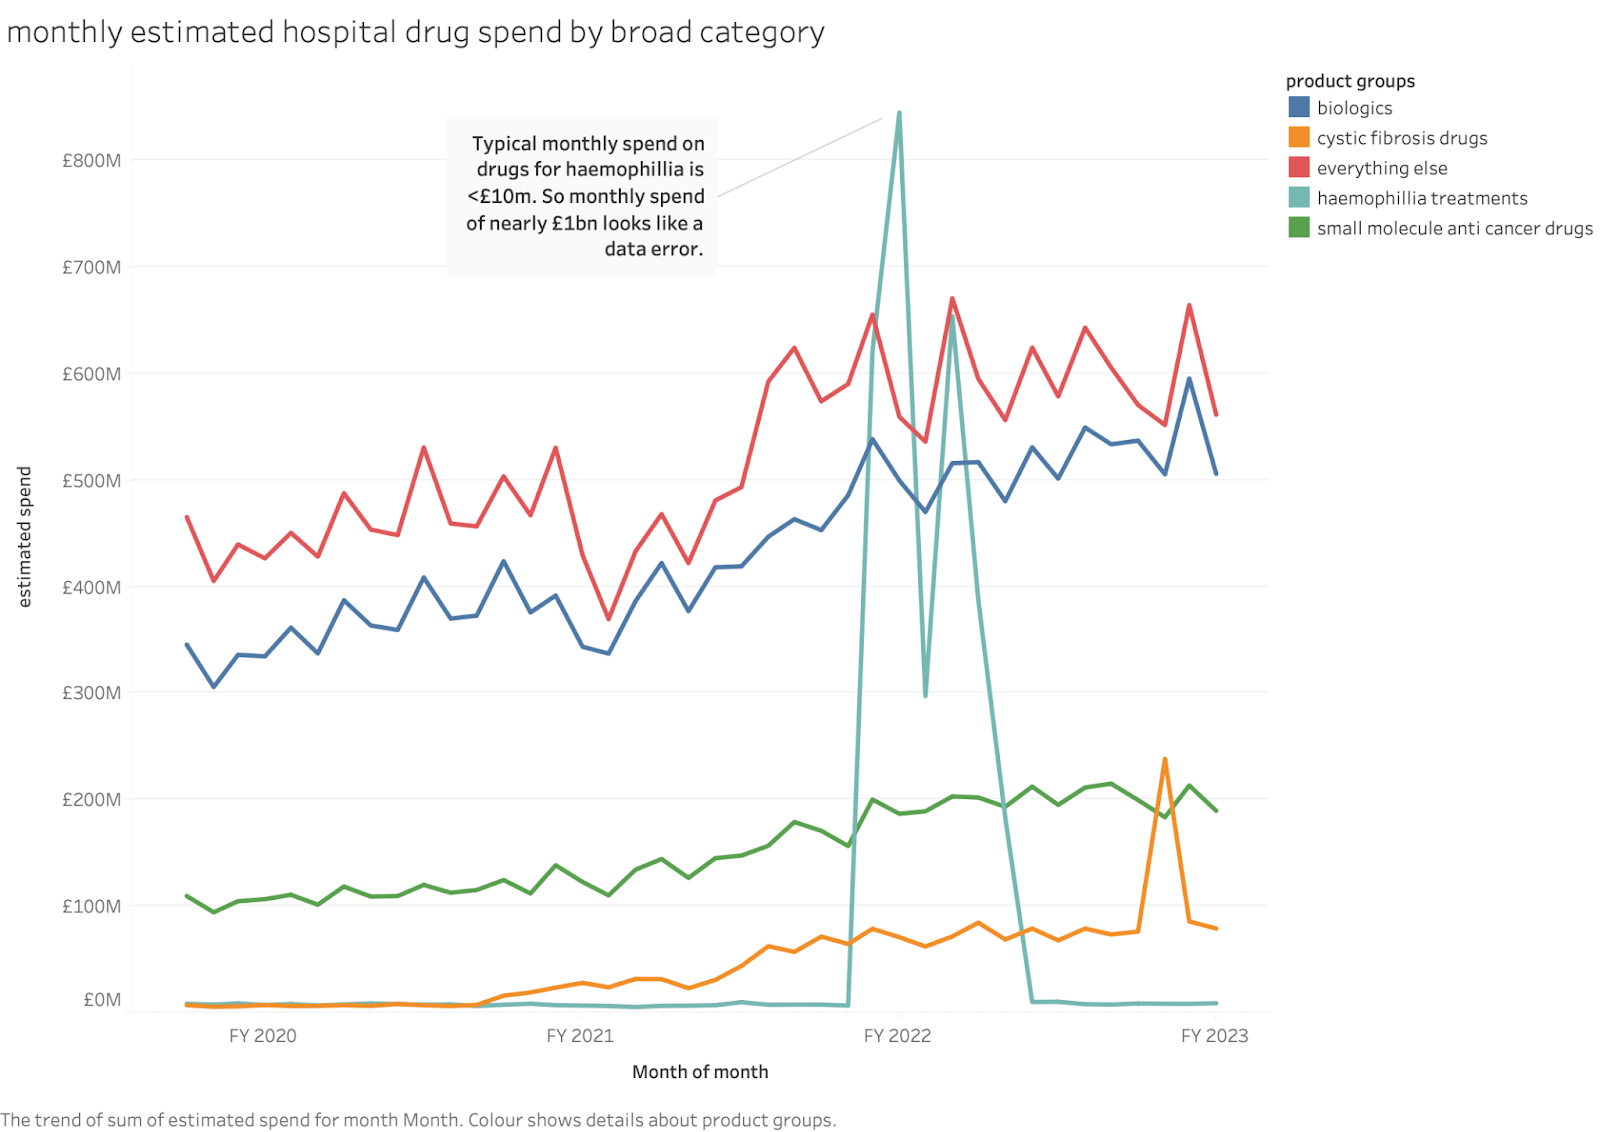


The apparent spend on turoctocog alone was over £500m in june 2021, more than a third of the total hospital spend on all drugs. I can think of no good explanation for this (if anyone knows one, please tell me) so I'm assuming it is a data error (maybe someone confused pounds and pence on data entry?). I have excluded the whole class from totals later in this blog (this makes little difference outside those months).


Some might argue that this invalidates the whole dataset. I prefer the idea that a lack of transparency and external analysis makes big data errors harder to find or correct. 


Another issue is that the new dataset only has estimated costs for about 1 year. But I've taken the unit costs from the period with prices and applied them to the volume data so I can estimate total costs from the whole 3 year period (usefully, this agrees with the last total from the NHSD estimate of annual spend).


What can we tell from a quick analysis of this new data source?


As a first rapid check on the consistency of the spending totals, we can check that the NHS financial year 2019/20 is close to the one given in the NHS Digital annual series (19/20 is the last total in that series). Luckily it does:


The growth rate of annual spend is about 20%/year. This is higher than the ~14%/yr in the years from 2010 to 2020 in the NHSD annual series. The rate of growth suggests that hospital drugs are taking up a larger and larger share of NHS spending since the overall budget which has grown at less than 4% over this period. An annual growth rate of 15% doubles the total in less than 5 years. Crudely, hospital drugs now consume about 10% of total NHS spend compared to about 4% in 2010. That's a big, rapid shift that shows no signs of slowing down. 


It is worth noting that even if the estimated prices here are wrong (because they might omit specific discounts negotiated by hospitals) that growth rate is still a worry. Also the estimated prices for drugs like Humira (adalimumab, used in autoimmune diseases like rheumatoid arthritis) is already about 10% of the price in the USA, so the totals are not vastly exaggerating the spend by using US prices.


There are about 3k different substances in the list with about 12k distinct formulations. But these can be grouped into broad categories that make it easier to see the key patterns.


The split of spending across broad drug categories is shown below. Note that, if I showed the annual spend in FY 2021/22, the total would be wildly distorted by the data error for haemophillia drugs (which added ~£2bn to that year when the typical annual rate of spend is <£100m).
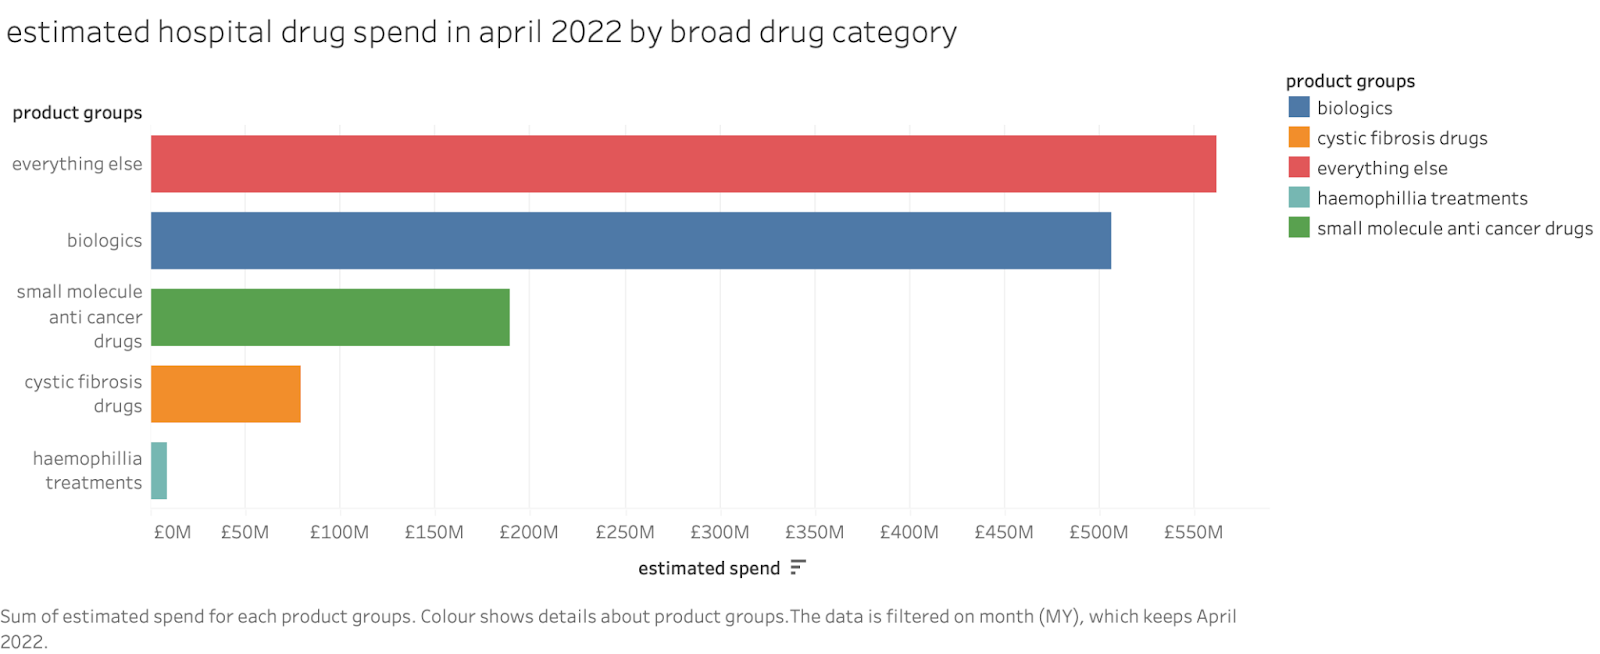


These categories are probably imperfect as I have to group drugs by name and manually but it is probably not too far out as there are not many big cost drugs and they can be checked by hand.


There are only about 39 drugs with spend above £100m a year. These are shown below:


The list is dominated by modern biologics (all monoclonal antibodies) which are used in autoimmune diseases and cancer, small molecule anticancer drugs and the new category of cystic fibrosis treatments.


How have those new categories grown over time? This is shown below:


Over just that 3 year period the annual rate of growth for anti-cancer small molecular drugs was ~20%/yr and biologics grew at ~13%/yr with the everything else group at about 6%/yr. The rapid growth rates of biologics (many of which are anticancer therapies) and anti cancer drugs is very notable. We can't tell this for sure with this small time period, but it is likely that these are a major contributor to the rapid growth of the headline spend shown in the NHS Digital annual totals since 2010. 


The data also contains information about which hospitals used the drugs. Without a lot of extra analysis, I can't be confident that practice in use of these drugs is consistent. It seems likely, though, that it practices varies widely as the top spender in april spent over £50m but there were 63 hospital trusts (out of nearly 200) that spent <£1m.


It seems likely to me that, if we could manipulate and analyze this data as well as primary care data, we could spot large variations in practice and drive some more convergence around what constitutes good value for money.


So what?


The first lesson here should be that it is important for the NHS to know where its budget is being spent and what it is being spent on. This budget has had very little public scrutiny.


In an area of spend with such rapid growth it is vital that we know the money is being spent well. Hospital spend on drugs seems to have grown from perhaps 3-4% of the total NHS budget in 2010 to more than 10% in 2022. Even if you argue that the indicative spend above is misleading as hospital pharmacy teams negotiate big discounts over the indicative price, the rate of growth in spend is extremely worrying. At this growth rate, even if the total is overstated by 30% because of discounts, it will reach the totals quoted above within 2 years. And without adequate analysis or control it will keep growing at the same rate consuming more and more of the NHS budget without any confirmation that we are getting the vastly improved outcomes we would expect.


On the topic of discounts, some hospital pharmacists told me they were, in fact, saving the NHS large amounts by negotiating big discounts and should be credited for the several billions of savings from those. But that misses the point that the total spend is rising rapidly, despite their claimed savings. Besides, they could claim that the NHS is saving £5bn/yr on Humira (adalimumab, the biggest drug in the hospital budget) because the NHS pays only 10% of the US price. But these numbers are about as meaningful as the "savings" during a DFS sofa sale.


Another comment from insiders was that this vast growth in spend is policy. "We have to use those expensive new drugs because NICE says so." Or because whatever the cancer drugs fund (or whatever it is called now) says. But NICE doesn't say to give new drugs to every patient. Hospitals still have to judge whether the incremental improvement in QALYs is worth it beyond providing false hope to sick patients. And this is hard to judge without the ability to combine drug usage data with outcomes and to benchmark practice across multiple hospitals which historic versions of this data have made almost impossible and even the recent releases don't make easy. And many of the new cancer drugs are not major breakthroughs that cure cancer, but incremental improvements that add just a year or two to "progression free survival". 


Since 2010 the NHS budget has grown by perhaps 3% a year. The hospital drug budget has grown by about 14% a year and that rate appears to be increasing. What else did the NHS stop doing to free up that money? Much of the money comes from the specialized commissioning budget, but that is legendarily the most out of control in the whole NHS so it isn't clear that anyone knows. 


Where are the big improvements in cancer outcomes? How many QALYs has an increase in the annual budget of >£10bn/yr since 2010 bought the NHS? 


To put this in perspective, it costs the NHS about £9bn a year to run GP practices and they dispense about £9bn a year of drugs. The hospital drug budget is estimated to be bigger than both combined in 2022. Adding about 15% more to the GP budget (roughly the cost of the long stated target to add 6k more GPs) would cost about maybe £1.5bn. Many estimates suggest this would improve the quality and outcomes of care in the NHS by a large margin (probably decreasing mortality by notable amounts according to an old estimate). That is less money than the annual increase in the hospital drug budget.


To put this another way, we have no idea whether the NHS could have improved the health of the whole english population by a much larger amount had it chosen to spend this money on something else. The lack of attention to this huge budget and the lack of detail about what it has bought the NHS in outcomes is a huge problem that deserves far more attention. 


Conclusion


The rapidly increasing NHS spend on expensive hospital drugs seems to have gone almost unnoticed even though it must be displacing other–potentially more useful–areas of activity. NHS leaders have recently, for example, called for a clamp-down on GP overprescribing despite this being a tiny problem in comparison and one that is getting smaller every year not least because of the well curated detailed, public data about primary care prescribing. 


The NHS needs to pay more attention to hospital prescribing. It should be spending serious effort in several areas:

  • Fix the obvious errors in the data

  • Spend the effort to create a coherent hierarchical classification of the drugs to facilitate coherent analysis

  • Map the spend and volume data to clinical outcomes to make it easier to judge the benefits

  • Start including reliable data on the actual (not indicative) spend (which might require radical approaches to commercial confidentiality)


If it doesn't do this the risk is that this spend will continue to consume an increasing proportion of the NHS budget with no assurance that it is improving outcomes. Never mind improving outcomes more effectively than spending the same budget elsewhere.


Tuesday, 5 October 2021

GP prescribing is one of the few areas of NHS spending that is under control

Last week the government released a report on overprescribing that suggested perhaps 10% of prescriptions issued by GPs were unneeded or harmful. The media headlines tended to frame this as another reason to attack GPs. The Telegraph, for example, had this headline: "GP's needless prescriptions push drugs bill to £9bn…"


This framing was wrong but also led to a huge story being missed and an important lesson being ignored.


While GP overprescribing is a problem that deserves to be tackled, it is a far smaller problem than hospital prescribing and is already being tackled (for example, the report highlights the campaign against antibiotic overprescribing in the mid 2010s that led to substantial reductions). 


The GP prescribing budget is one of the few areas of NHS spending that has been under control. It has been between £8bn and £9bn for longer than a decade and has shown as many falls as rises year on year. Overprescribing by GPs is not driving spending up.


Hospital prescribing, on the other hand, has risen from £4.2bn in 2010/11 to £11.7bn in 2019/20 and is rising at a rate of between 8% and 16% every year (see the NHS Digital data here:https://digital.nhs.uk/data-and-information/publications/statistical/prescribing-costs-in-hospitals-and-the-community/2019-2020 ). See the chart: 


(the numbers above the bar are the annual growth rates in the spending)


This is out of control and, unlike GP prescribing, is a big problem.


We have a good idea why one budget is under control and the other is not. Detailed data about what is happening in GP prescribing in England is available and has been public for more than a decade. Analysts like me can count the number of prescriptions for, to give an example, 20mg simvastatin pills, in every GP practice every month. This hugely rich dataset covering more than a billion annual prescriptions can be interrogated to reveal the differences among practices for every one of the 20 or 30 thousand items they can prescribe (Oxford's EBM Datalab even provides a free interactive tool allowing anyone to analyse the data: https://openprescribing.net/ ).


We don't yet have anything like that for hospital prescribing (the Datalab is working on one but it isn't complete). For many years the only source the NHS had was data bought from an external firm which had restrictive clauses preventing detailed use or dissemination of the numbers (that external firm's primary purpose for collecting it was to sell it on to the pharmaceutical industry for sales analysis, not to help the NHS get a grip on its spend). The NHS has no mandatory collection of data that would give it the same level of insight it already has for GP prescriptions.


Given how little we know about hospital prescribing, there is little mystery why the budget is out of control (and rapidly approaching 10% of the whole NHS budget). When the NHS has exquisitely detailed data about what is happening it can get a grip on both quality and spending; when it doesn't, the budget is out of control and the system has no idea about the quality. For all we know hospitals are wasting gargantuan amounts of money and overprescribing on a massive scale.


We should be praising GPs running one of the most well-managed areas of NHS spending. And we should be scandalised, instead, by the NHS's failure to collect the data necessary to get a grip on out of control prescribing by hospitals. That's what the headlines should have been last week.


Tuesday, 13 November 2018

You can't make the NHS better by optimising its components.

In a system with many interdependent parts trying to optimise the parts separately doesn't optimise he whole. Local optimisation doesn't lead to system optimisation. This is a lesson NHS management needs to learn in many areas from how emergency care is managed to how the costs of diabetes are minimised.


There is an old (possibly apocryphal) story about the perils of central planning. Stalin issues a demand that factories improve their productivity by producing more output for the same number of hours worked. Some clever factory manager realises that the switch from producing left-footed shoes to right-footed shoes wastes time so he mandates that the factory only produces left handed shoes. Output of shoes rises significantly and he makes his productivity target. But, of course, this is terrible for the people as one left shoe is useless by itself (unless you are a one-legged war veteran who lost his right leg and there are few of those not least because war injuries don't discriminate which leg is blown off).


If your local metrics are wrong, factory productivity is not a good indicator of system productivity.


But this sort of naive focus on local metrics is, even now, a big problem in the NHS (which also suffers many of the other problems inherent to centrally planned systems).


The NHS is short of managers and is particularly short of skilled managers. The system sometimes seems to hate them not least because many politicians seem to regard them as parasites who suck resources away from the heroic front-line staff (even Sumproduct Phil's newfound largesse came with the warning that the extra cash should go to the frontline not the "bureaucrats"). But managers are necessary in any system not least because a poorly organised and coordinated system will function badly however many "front-line" staff it has.


One particular failing of management-lite systems is that there is nobody to do the system-level thinking that makes that coordination work. So, many management decisions are divided up into smaller decisions that can be made locally with no attempt to consider the system-level consequences. This is one factor leading to poor system productivity. The drive to improve system productivity is reduced to a set of local initiatives to drive up local productivity and, like the shoe factory, this doesn't achieve its intended goal.


Optimising A&E doesn't fix the A&E performance problem
Take, for example, the drive to improve A&E performance. It is all too common for this to be seen as a problem for the A&E department. So local managers devise local initiatives to improve staffing, reorganise flow, divert patients, develop clever ways of dodging the 4hr metric and so on. But these don't work. So leaders put more pressure on staff to work harder and do better. But the staff are demoralised from all the previous initiatives and become burnt out, increasing turnover and continuity. The initiatives repeatedly fail; morale and engagement fall. More pressure is exerted and the downward spiral continues.


I've ranted about why this happens plenty of times. But the key point here is that poor A&E performance isn't (mostly) an A&E problem. It is a system problem. Much of the problem is a failure of flow through beds (which are not controlled by the A&E department but by the specialites running wards). In turn, some of their problem is caused because the hospital is not in control of the systems in the community that can get patients the appropriate community care they need.


This problem needs joined up thinking to create any hope of a solution. Trying to fix it by putting more and more pressure on the A&E department is futile and, if anything, makes the overall problem worse.


Local optimisation doesn't lead to system optimisation.


Minimising the cost of blood-glucose testing doesn't minimise the cost of diabetes
In another example recently I heard of some CCG attempting to use RightCare metrics for the cost of diabetes blood-sugar tests to drive lower spending. Now there isn't anything wrong with trying to use the cheapest effective technology as this frees up money to use elsewhere for other treatments. All other things being equal, CCGs should aim to use the cheapest technology that does a good job. But all other things are not equal, and some of those other things matter a lot.


The problem here is that diabetes is a complicated area and what you do with testing affects the need for treatment elsewhere. The background is that diabetics with good blood sugar control have far fewer complications in the future. But it is also important to note that most diabetics do not test their blood-glucose often enough to achieve good control, partially because pricking your fingers 10 times a day in inconvenient and painful. We just don't prescribe enough blood-glucose test strips for all insulin using diabetics to test as often as they should. There is a reasonable case for saying CCGs should encourage more testing (or new technology like the Freestyle Libre continuous glucose monitor which, in effect, allows 24hr continuous testing for the same price as the recommended levels of finger prick tests).


But the easiest way to control the cost of glucose testing is the limit the number of test strips issued to that CCG's population. That is picking the wrong metric for the wrong local optimisation. Sure, if you limit the number of test strips issued you will look good on the spending metric compared to other CCGs. But your diabetics will do fewer tests, will have worse glucose control and will end up with more diabetes complications.


And this is really, really bad for the system as a whole. To see why look at the overall costs of diabetes. A recent estimate puts the cost of diabetes to the NHS at around £10bn/year. Drugs alone are only about 10% of this, costing a smidgen under £1bn in 2017 in England. Blood-glucose monitoring costs <£200m out of that total. Most of the rest (certainly 75% of it) is spent dealing with the complications of diabetes (in the long term many amputations, many cases of blindness for example, are caused by diabetes but, even in the short term, poor glucose control leads to many hospital admissions for high or low blood sugar which can be life threatening if not treated promptly).


So trying to limit the testing spend (the <£200m) might be good if considered in isolation. But it doesn't look so good if it involves any risk at all of increasing the multiple billions spent on complications. Which it does.


So far I don't know many CCGs trying to limit the spend this way. But most of them are guilty of making a similar sort of choice when it comes to new technology for testing blood glucose. Abbott's Freestyle Libre is a wearable monitor that tests blood glucose every few minutes to give a complete 24hr profile that provides the sort of insight that enables diabetics to achieve much better control. Libre would cost about £900/yr if CCGs made it widely available. This is about the same cost as conventional testing for diabetics who test 10 times/day (which is what they need to do to get good control as NICE advises). But most diabetics don't test that much so moving to Libre would cost more and CCGs are resisting that switch (and inventing incoherent clinical reasons to justify that stance). None of the CCG documents justifying this stance even mention the other costs of diabetes or how they could be improved by more blood-glucose testing leading to better control.


Their local optimisation of the cost of glucose testing is a catastrophe for the total cost of treating diabetes across the whole NHS. Even a modest improvement in average blood-glucose control would yield a huge gain in the cost of complications. This will never happen if all CCGs consider is the local cost of testing.


In a complex system like the NHS local optimisation is dumb
The point uniting these two, very different, examples is they both involve local optimisation and a failure to think how one part of the NHS is connected to other parts. Trying to fix the whole NHS by telling its parts to maximise their productivity or minimise their costs doesn't work.


Every part of the NHS needs to understand how it fits into the system and how it interacts with the other parts. And everyone's goal should be to make the system work better not just their little, local part of it. Productivity in the NHS won't improve if we don't

Tuesday, 25 April 2017

Wrangling English prescribing data

This is a technical post intended to remind me of what has to be done to make sense of English prescribing data, an amazingly useful open dataset that summarises everything dispensed in the community in England (which accounts for about £8bn or about 8% of NHS spending every year). For all its usefulness, it is a pain to do analysis with it for a variety of reasons. I hope that by describing how to make sense of it my notes will also be helpful to others. I may update this as I work further with the data.

Introduction


The trouble with english prescribing data is that, although it has been openly available since 2010 (every month we can see exactly how many prescriptions of each type are dispensed in the community) it isn't easy to make sense of it.


The raw data released by NHS Digital consists mainly of a file detailing the BNF code (a 15 character code describing the exact item being prescribed, BNF is the British National Formulary), the GP or clinic code for the issuer of the prescription, and the amount of things prescribed (by book price, actual cost after discounts and charges, number of pills/volume/units). What it doesn't have is the sort of metadata that helps you group these things together into useful categories (GPs mapping to CCGs or the grouping of drugs into categories).


The BNF code does contain useful information to solve some of that problem and there are lookups for the mapping of GPs onto bigger units. But these have to be downloaded from other sites and the extra data doesn't always map neatly onto the raw data. This blog describes how I sort, wrangle and combine the sources to make something more useable partially to help me remember and also so others can see roughly what is required if they want to play with the data.


BNF codes


BNF codes actually contain a hierarchical coding that groups drugs and devices into categories. The codes group drugs into chapters, sections, paragraphs and subparagraphs. Chapters are mostly about what sort of problem the drug deals with. For example, there are chapters for drugs treating the digestive system, drugs treating infections and devices for incontinence. The other levels group these together in a fairly reasonable hierarchical classification. It works like this:
  • Characters 1-2 code the chapter
  • Characters 1-4 code the section
  • Characters 1-6 code the paragraph
  • Characters 1-7 code the subparagraph
  • Characters 1-9 code the chemical or device
  • Characters 1-11 code  the product (often essentially the same as the chemical)
  • The remaining characters code the specific item (different versions of the item, different formulations of the same drug, different strengths of pill, etc.)


There are some complications on top of this, though. Dressings and appliances only have 11 characters in their codes (though the raw data makes all codes 15 characters long by right-filling the codes with blank spaces, some metadata sources use a mix of 11 and 15-character codes just to be really annoying).


So, while we can derive a hierarchy from the raw data, we need to find a source for the names of chapters, sections, paragraphs and so on (the raw data comes with a file describing the names of each specific item's formulation). We could just buy the latest BNF (available in book form with all sorts of useful advice about drug use, safety and dosage and updated every six months). But the book is over 1,000 pages long and there are nearly 40,000 items to code so it isn't a very practical way to get the metadata unless you are both a masochist and a good typist.


Annoyingly the BNF doesn't, as far as I can tell, release an electronic form of the data (even their iOS app requires an Athens login presumably in a futile attempt to prevent non-qualified people misusing the data even though those who want to can just buy the physical book). But the BSA (the NHS Business Services Authority, who compiles the data from the raw prescriptions used to pay pharmacists), does. It is accessible as described in this useful opendata.stackexchange post. But the BSA have a deserved reputation for being annoying awkward bastards when it comes to open data. The opposed making the raw data available as opendata when Tim Kelsey originally proposed the idea. Their own tools for accessing the data are clunky, slow and primitive. And they don't fall over themselves to make anyone else's life easier. For example, their metadata is coded using both 15 character and 11-character BNF codes (unlike the raw data which pad all codes to 15-characters long). Worse, the lookups are inconsistent from year to year (the 2016 release has 35,673 BNF codes but the 2017 release has 74,653 even though the entire public dataset doesn't have that many unique codes in it). Worse still, not every code in the public data has a matching code in the metadata file.


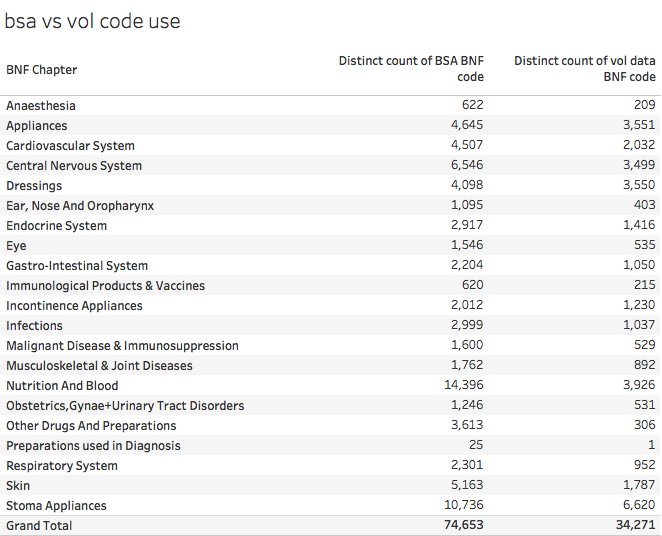
It is unclear why there are so many more codes in the latest BSA metadata. Here is how this looks compared to the number of codes actually used in the raw volume data:


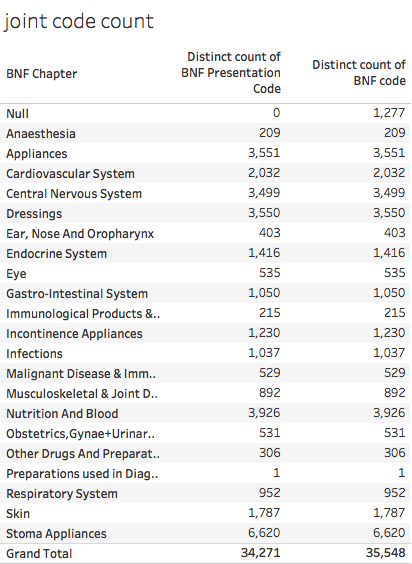
And this understates the scale of the problem as some of the codes in use don't match anything in the metadata. This table shows that problem:


This table shows that 1,277 codes in the raw data are not present in the 2017 metadata at all.


This is pretty fucking annoying for those of us who want to do analysis.


All is not lost. The correct position  in the hierarchy can be retrieved for the things actually prescribed as their codes contain some of the information about their position in the hierarchy (remember the BNF code contains the chapter, paragraph etc. codes).


So we can highlight the 1,277 missing BNF codes by doing some SQL magic in BigQuery:


Screen Shot 2017-03-28 at 18.22.45.png
And then we can reapply the known chapter, section etc. values, where they exist. Unfortunately, they don't always exist because the BNF sometimes revise the hierarchy, adding new ways to classify drugs. The biggest change recently was the introduction of a new paragraph and subparagraph classification for drugs used in substance abuse. This replaced the codes of drugs with new codes but means that the old codes won't fit correctly into the new classification. This can be fixed manually, though it is a pain in the arse to do so.


In addition, the raw data files containing metadata for chemical/product names uses a different structure for the chemical codes for the chapters consisting mostly of devices and dressings (all chapters>19). Instead of a 9-digit code the product/chemical is described by a 4-character code (ie the same as the paragraph code).


But, despite these difficulties, I persisted anyway. I extracted the codes actually used in the raw data and filled in (to the best of my ability) the missing hierarchy parts so that I could produce (nearly) complete classifications of everything actually prescribed.


Prescriber Locations


Then we have the problem of knowing who prescribed and where they are geographically. The raw data contains the prescriber code (some clinics but mostly the standard code for GP Practices). It also contains fields described as SHA and PCT.


Unfortunately the NHS has been reorganised since the data was first published and both Strategic Health Authorities (SHAs) and Primary Care Trusts (PCTs) were abolished and replaced by NHSE Area Teams (NHSats or some acronym like that) and Clinical Commissioning Groups (CCGs). The data in the SHA and CCG columns switches to new codes somewhere in the middle of the timeseries. This is sensible, but has the major disadvantage that the raw codes don't allow a consistent set of regional comparisons over time even though the actual people doing the prescribing are the mostly same (neglecting the small number of closed and new GP Practices). Another problem is that the fields contain codes that are not regional or local bodies. Some look like the codes of hospital trusts; sometime SHA codes appear in the PCT field and sometimes codes are used that don't appear to match anything I recognise.


There are two ways round this problem. One is to use the geography of postcode locations to map the locations of practices onto the area where the postcode is located. The ONS produces lookup tables showing the higher-level geographies each of the ~2.5m postcodes in the UK resides in. This won't always match the actual NHS administrative hierarchy for GPs, but is is close and we can extract the relevant NHS codes from a single lookup table, the ONSPD table which is large but manageable and downloadable from the ONS Geography portal.


The alternative is to match GPs to CCGs using the lookup tables NHSE are supposed to provide. This should be exact, but the tables are not always up to date and some codes were altered after the original release (presumably just to make life harder for analysts like me). And CCG membership and boundaries have changed several times due to GP defections, and CCG mergers/splits. Since doing consistent geographic analysis is clearly a waste of time for everyone, why should I expect this to be made easy for me?


Even if we use the NHS GP to CCG lookups, we still need the ONSPD file to identify the precise location of practices. This file, at least in recent versions, give the lat/lon of every postcode so enabling location maps with little fuss if your choice of analysis software can map using lat/lon (I use Tableau which can draw a map as soon as you give it a lat/lon).


Back to the raw data which has some further traps for the unwary. Alongside each month's prescribing data,  NHS Digital release a file containing the lookup from prescriber code to prescriber name and full address. WOOT! You might think, problem solved. Unfortunately not completely as there are some consistency problems. For each practice code there are a practice name and 4 address fields in the data. The last two address fields should contain town and area, but often don't. Sometimes the last field is town; sometimes it is blank; sometimes the town fields contains a third address. Luckily we rarely need those full addresses so we don't need to fix these inconsistencies. But we do need the postcodes and they are, at least, all in the same column of the data.


But not in a consistent format for fucks sake. There are several possible standard ways of formatting postcodes (the ONSPD file has three alternatives in case your data uses a different one). This happens because postcodes have different numbers of characters (for example, B1 7PS; BT6 1PA; SG18 2AA; SW1W 9SR). You can force fit all postcodes to 7 characters (some will now have no spaces), 8 characters (some will have multiple spaces) or a variable length which always has just one space in the middle. The raw data for prescriptions is supposed to be in the variable length format. And it often is, but not always. In some months some of the postcodes have an extra trailing space which means that any lookup to location using the ONSPD file fails. It is easy to fix (databases and spreadsheets have TRIM functions to remove redundant space) but why didn't NHS Digital apply this before releasing the damn data. It isn't as if they are even consistent every month.


This isn't the only problem with the postcodes. Some of them are wrong. It is almost impossible to tell this unless you draw maps and observe locations over time (I do which is why I spotted the problem). Some practices change postcode over time in ways that don't make sense. Sure, some practices move location to new buildings and get a new postcode. But in the data some make leaps of hundreds of miles and then move back. On investigation, some codes have been transposed from practices near them in the list in some months. This isn't common, but suggests that some analyst has been making transposition errors when putting the data together and hasn't found a reliable way to validate the whole monthly dataset.


Putting it all together


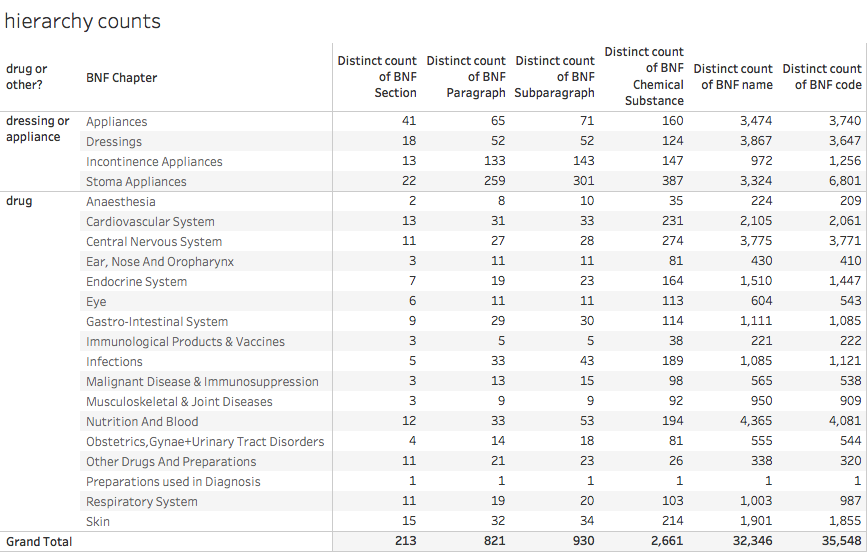
Now we have a (mostly) complete way to classify drugs we can look at the whole hierarchy. A summary is given below:


hierarchy counts to dec 2016.png


Note that the number of distinct names doesn't entirely correspond to the number of distinct codes. This is because of several factors: sometimes the name is changed over time for exactly the same product; sometimes the hierarchy is reorganised giving existing drugs a new BNF code (for the same exact product) and a variety of other reasons.


Normalising the results


Sometimes we need to know more than just the total amount prescribed. When we want to compare GP Practices, for example, we need to account for the fact that GP lists have a wide range of sizes and population demographics. A fair comparison of two GPs requires adjustments for both the size and age mix of their populations. The old pop a lot more pills than the young so any comparison needs to adjust for the age mix or it won't be fair.


The simplest normalisation is pills per head which is easily derived from gP Practice List size. A better comparison needs to use the whole demographic profile for the population on the list. Two common schemes are to use units known as ASTRO PUs and STAR PUs. ASTRO PUs take into account the age/sex mix by defining a standardised rate of prescribing by number or spend for different age/sex bands in the population (which is originally based on the English average rate though the actual analysis is only done every few years). STAR PUs are defined for specific categories of drugs where the national rate may be inappropriate.


An ASTRO PU (item or cost) is the cost or number of items that a practice would be expected to incur if it prescribed in exactly the same way as the average practice in England. Per quarter (so you need to adjust the timescale if you are working with units other than quarters). I create a table of monthly ASTRO PUs from the quarterly population data so I divide the values by 3 to get an expected monthly number of units.


But deriving the relevant factors for a Practice is not simple as list sizes change over time. And, as usual, you have to find the data, which isn't trivial. The NHS BSA have some but it only starts in 2014 (our prescribing data starts in mid 2010). NHS Digital have quarterly data from 2013 and, if you search carefully enough, some data from 2011. But no obvious single series going back to before 2013.


And that isn't the only problem with the data. Recent quarters add the useful extra information containing the ONS standard codes for NHS geographies as well as the NHSE codes. But this means the files are now in a different format and must be edited before being combined into a single source. Plus the file names are inconsistent and don't (usually) contain date information so you have to edit that in manually.


To add some anal-probing to the severe beating the poor bloody analyst has already taken, they extend the age bands in 2014 and later data to include 85-89 and 90-95 (previously ended with 85+).


In fact here is a suggestion for how NHS Digital could make everyone else's life easier: copy the Land Registry. They release monthly files of house sale transactions in a consistent format that is easy to join together if you want to create a bigger dataset covering a long time interval. And they also publish a single consolidated (and very large) file that contains all the data they have ever released so you can get a consistent single file with all the data you want with just one download. Or you can do the big download to get started and then update every month from the monthly release without worrying about consistency or manual edits.


Conclusion


The bottom line is that making sense of England's prescribing data is possible, but, at least for parts of the relevant data, unnecessarily hard. The difficulty of deriving joined-up datasets that can be visualised is far, far harder than it should be. It is as if there were a conspiracy to stop open data actually being useful.


NHS Digital could help. They could release the data and all the associated data in a single place where users could use it immediately. They could create repositories that release the data in a single lump rather than in monthly extracts. This wouldn't be easy as CSV files (the result would be far too big compared to the Land Registry where the accumulated file containing all house prices since the mid 1990s is only ~3GB as a single CSV. But there are people would probably do it for free if asked nicely: Google already host bigger public datasets on their BigQuery data warehouse and Exasol have assembled the core parts of the prescribing dataset on a public server for demonstration purposes (see http://www.exasol.com/en/dataviz/ where you can register for access to this and other interesting datasets and many examples of data visualisation based on them). This is the sort of thing that NHS Digital ought to do to encourage the use of their data. Diesseminating it isn't enough.


I should also mention that Ben Goldacre and Anna Powell-Smith have produced an online viewer (https://openprescribing.net) for many aspects of the data but it doesn't (yet) have true freedom to explore any aspect of the data any way you want.

And, not forgetting, my Tableau Public summary of the national data (which leaves out GP-level data to fit into a public worksheet).