
[Update: I need to issue an important caveat about the analysis in this post. When published, I had just been made aware of new and very detailed data sources about hospital prescribing, monthly sources with detailed analysis of volume and indicative price. The analysis was based on those sources and was consistent with a longstanding NHS Digital annual report on the total cost of hospital prescribing. But when the analysis attracted some attention, it was pointed out that the indicative pricing data was highly unreliable because of commercially sensitive discounts that were missed in the public data (including the NHS Digital totals that had been available for about a decade). Some new sources (though they are very, very hard to find, have the (apparently) correct total spend but not the detailed monthly detail on individual drugs).
So any total spend numbers in this analysis may be large overestimates, though volume and price trends are probably correct.
But the situation is a complete clusterfuck as the NHS has been publishing badly incorrect data on total spend for more than a decade. And we still do not have any reliable way to analyse where the hospital drug budget is going or test its value for money. But it is important to be aware of the possible errors when reading the conclusions. Though many are still valid. Which is why I am leaving this analysis here in the hope that our ability to analyse an important chunk of NHS spending will improve in the future.]
According to the data we have, hospital prescribing is one of the fastest growing areas of NHS spend. Until recently, the only public data we had was the total spend. In the last three years new sources on what is happening with much more detail have become available. In the last year this has included data about spend. So we can start to understand some details about what is happening. This is a preliminary analysis.
It is not, though, a thorough analysis. It can't be, as the availability of data is poor and quality of data is partly suspect. Some have questioned whether the financial data is reliable. I can't judge that, but, even if it is not accurate, the overall story is worrying as a major shift in NHS spending has happened without much scrutiny or deliberation.
My hope is that a quick and dirty analysis for this new data can kick off a debate and incentivise further work. It is clearly an area of NHS activity that deserves far more attention.
Primary care prescribing is a well-scrutinized area of NHS spending. It is controlled by GPs and costs the NHS about the same as all the payments made for all GP activity. Prescribing has cost the NHS about £9bn/yr for most of the last decade. And we know a great deal about it as the monthly data about all the prescriptions issued by GPs has been publicly available since 2010. So I can tell how many doses of 40mg simvastatin were prescribed by my GP in january 2011 and how much that cost the NHS.
We don't know the same for what hospitals do. Until recently, all we had was the total spend as published by NHS Digital here: https://digital.nhs.uk/data-and-information/publications/statistical/prescribing-costs-in-hospitals-and-the-community/2019-2020 . This dataset (which also contains the total spend in primary care) looks like this:

The GP prescribing spend is uncontroversial; the hospital spend total has been questioned when I have mentioned it on social media by some but the growth rate has not. If the NHS digital numbers can be trusted, this is a huge shift in NHS spending that has gone without much, if any, scrutiny. A simple projection of the 2019/20 total at the average growth rate suggests that the 2022/23 total will be about £17.5bn whis is both four times bigger than it was in 2010/11 and about the same as the total spend on both GPs and the drugs they prescribe. Or close to 10% of all NHS spend in England.
A large budget growing at 15% a year in an NHS where the overall budget is barely growing should be a significant concern for the system. Some might, rightly, ask what NHSE have cut to enable this rapidly increasing spend (note that all the numbers above are before the pandemic hit and before the government promised lots of extra money for NHS reform).
Historically there has been little analysis of this total because the data was provided to NHSE by IQVIA whose contract limited the detail available (possibly because IQVIA collected it to sell it on to pharma firms to help their efforts to market their products to hospitals).
Ben Goldacre and Brian Mackenna argued forcefully in the BMJ in 2020 that there were few excuses for not getting better information from hospitals and major benefits for doing so.
It is worth quoting some of their arguments (any emphasis is mine).
"...there is little publicly accessible data on what is prescribed and dispensed in each hospital. This effectively blocks work to identify variation and signals indicative of suboptimal care."
"...there are no technical barriers: data is currently extracted, aggregated, and normalised into one national dataset through at least two systems. Access to this data, however, is limited by a complex network of commercial contracts, apparent resistance to transparency at some NHS trusts, and historical reluctance to make change at a policy level.."
"Restricted access presents multiple problems. Firstly, it prevents analytic work by teams with the skills and creativity needed to generate actionable insights for diverse groups of users. A recent survey reported data access as a key barrier preventing early career NHS pharmacists using data to inform practice"
"Secondly, closed working models also create barriers to verification, critical review, and collaborative improvement of analytic work."
"Thirdly, restrictions around data sharing impede innovative approaches to improving quality, safety, and cost effectiveness using medicines data. Independent researchers working on primary care prescribing data have identified whole new categories of cost savings, novel informatics methods, and research on the reasons for slow and rapid uptake of evidence in clinical practice. Hospitals are where new treatments are most likely to be used and where costs are growing fastest; they are therefore where this kind of collaborative analysis is most needed, but it is currently prevented by data access barriers."
"Lastly, data access barriers prevent public and independent external scrutiny of hospital activity. Although publicly accessible data can be uncomfortable for organisations and requires thoughtful handling, thoughtful public scrutiny on public services can help build better quality, safer, and more cost effective care."
This article appeared to have an effect on the leadership who released a monthly datasource which starts in 2019. The new source contains volume data about every item used in hospitals and has recently been supplemented by information on the price paid for those items. The volume data is accessible here and the more recent data with indicative prices is here. Thanks to the team at openprescribing.net for pointing out these recent releases when I complained about the lack of good data on hospital prescribing.
What are the issues with the new data source?
There are several issues with the new hospital prescribing data source. Perhaps the biggest is that few organizations with the capacity to analyze it have had any time to do so. Even the team at opneprescibing.net who have done such a good job with primary care data.
Another big issue is that there is no coherent metadata to classify the drugs (primary care drugs can be grouped in a hierarchical classification based on the BNF which groups similar drugs for similar conditions together). This makes analysis harder. Another issue is that the prices are, again unlike the primary care data, "indicative" rather than actual (more on this later).
We can overcome some of the problems of not having a classification by looking at the generic names of the drugs which often contain big clues about the type of drug. Also, we can look the specific drugs up in formularies to work out what they are for. But there are about 12k unique names in the list of prescribed items and about 3k different names if you strip out the different formulations of the same drug (these are crude estimates based on some simple text parsing as, franky, who has the time to manually classify 12k bloody text strings). Luckily, many of the important classes of drugs (with large volumes or costs) are easy to identify. Modern biologic drugs for treating haemophillia, for example, all end in "cog"; monoclonal antibodies (a very expensive class of biologics used in cancer and some immune diseases) all end in "mab". So a quick and dirty classification is possible that highlights some of the key trends.
Applying this simple classification also reveals some detailed issues with the data. Those "cog" drugs, for example, show some data issues. Normally the monthly spend on the groups is £5-10m but between march and august 2021 that leapt to between £200m and £800m per month but fell back to ~£10m in later months. See this chart:
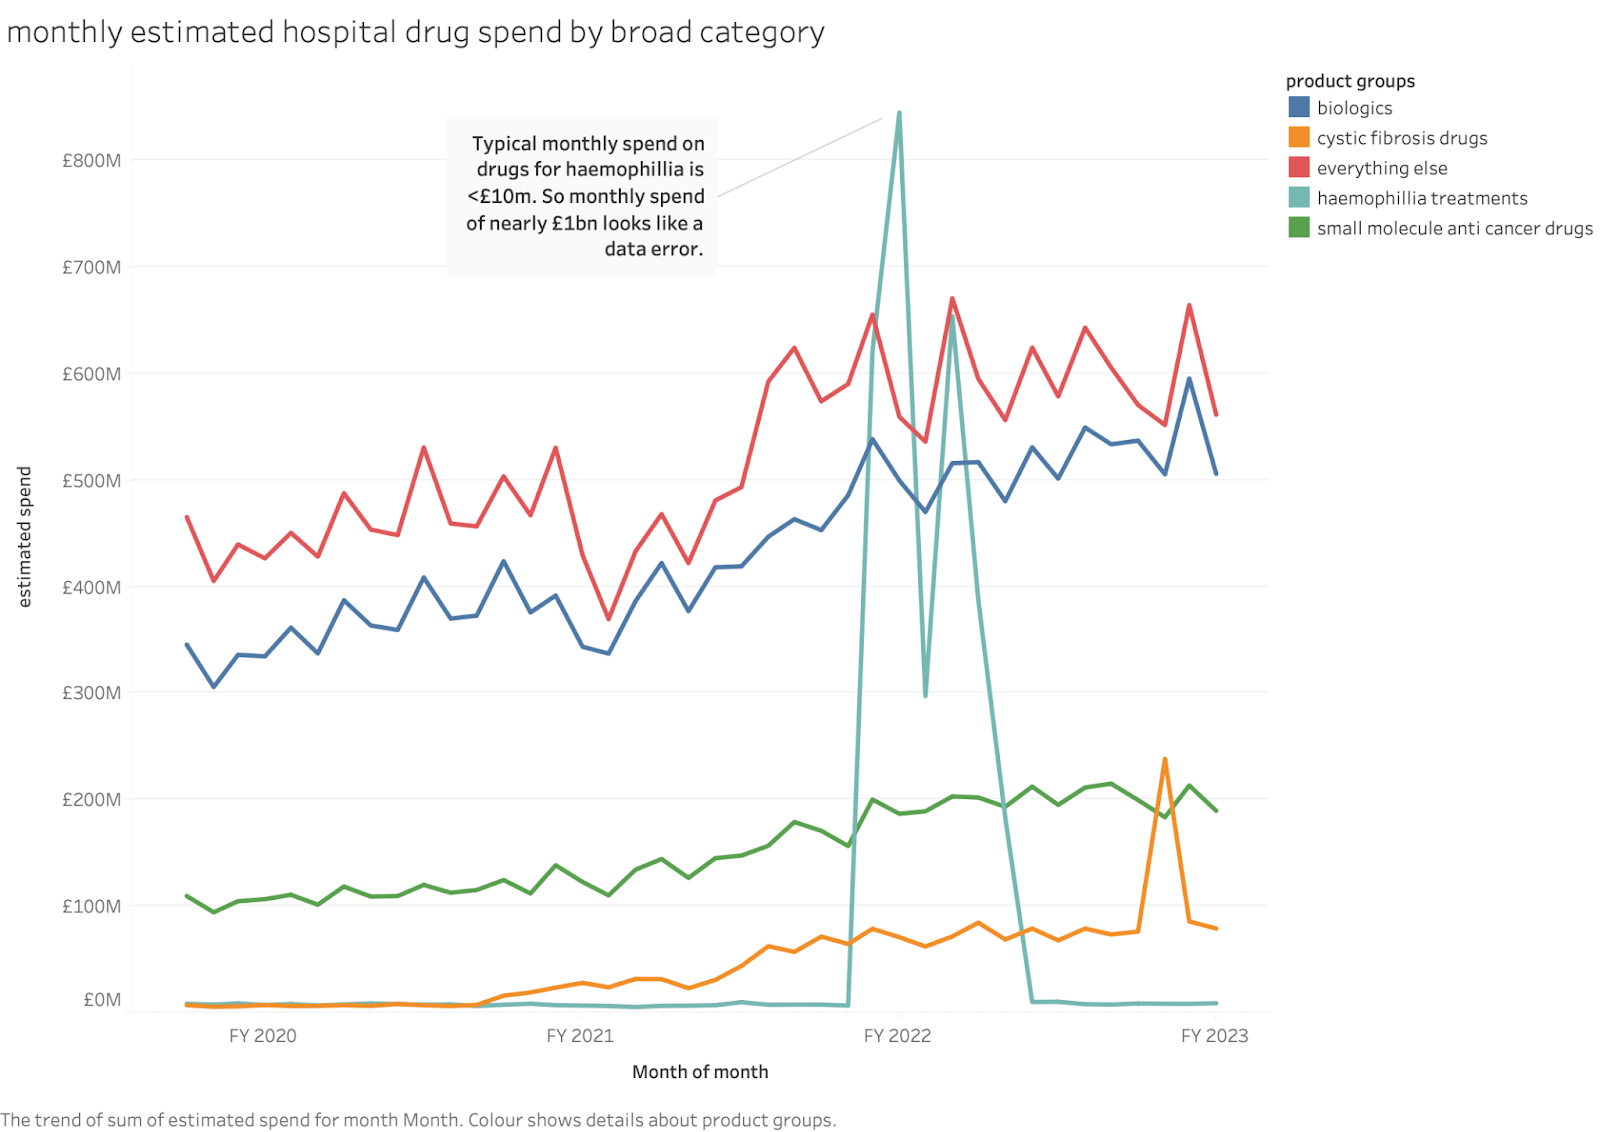
The apparent spend on turoctocog alone was over £500m in june 2021, more than a third of the total hospital spend on all drugs. I can think of no good explanation for this (if anyone knows one, please tell me) so I'm assuming it is a data error (maybe someone confused pounds and pence on data entry?). I have excluded the whole class from totals later in this blog (this makes little difference outside those months).
Some might argue that this invalidates the whole dataset. I prefer the idea that a lack of transparency and external analysis makes big data errors harder to find or correct.
Another issue is that the new dataset only has estimated costs for about 1 year. But I've taken the unit costs from the period with prices and applied them to the volume data so I can estimate total costs from the whole 3 year period (usefully, this agrees with the last total from the NHSD estimate of annual spend).
What can we tell from a quick analysis of this new data source?
As a first rapid check on the consistency of the spending totals, we can check that the NHS financial year 2019/20 is close to the one given in the NHS Digital annual series (19/20 is the last total in that series). Luckily it does:

The growth rate of annual spend is about 20%/year. This is higher than the ~14%/yr in the years from 2010 to 2020 in the NHSD annual series. The rate of growth suggests that hospital drugs are taking up a larger and larger share of NHS spending since the overall budget which has grown at less than 4% over this period. An annual growth rate of 15% doubles the total in less than 5 years. Crudely, hospital drugs now consume about 10% of total NHS spend compared to about 4% in 2010. That's a big, rapid shift that shows no signs of slowing down.
It is worth noting that even if the estimated prices here are wrong (because they might omit specific discounts negotiated by hospitals) that growth rate is still a worry. Also the estimated prices for drugs like Humira (adalimumab, used in autoimmune diseases like rheumatoid arthritis) is already about 10% of the price in the USA, so the totals are not vastly exaggerating the spend by using US prices.
There are about 3k different substances in the list with about 12k distinct formulations. But these can be grouped into broad categories that make it easier to see the key patterns.
The split of spending across broad drug categories is shown below. Note that, if I showed the annual spend in FY 2021/22, the total would be wildly distorted by the data error for haemophillia drugs (which added ~£2bn to that year when the typical annual rate of spend is <£100m).
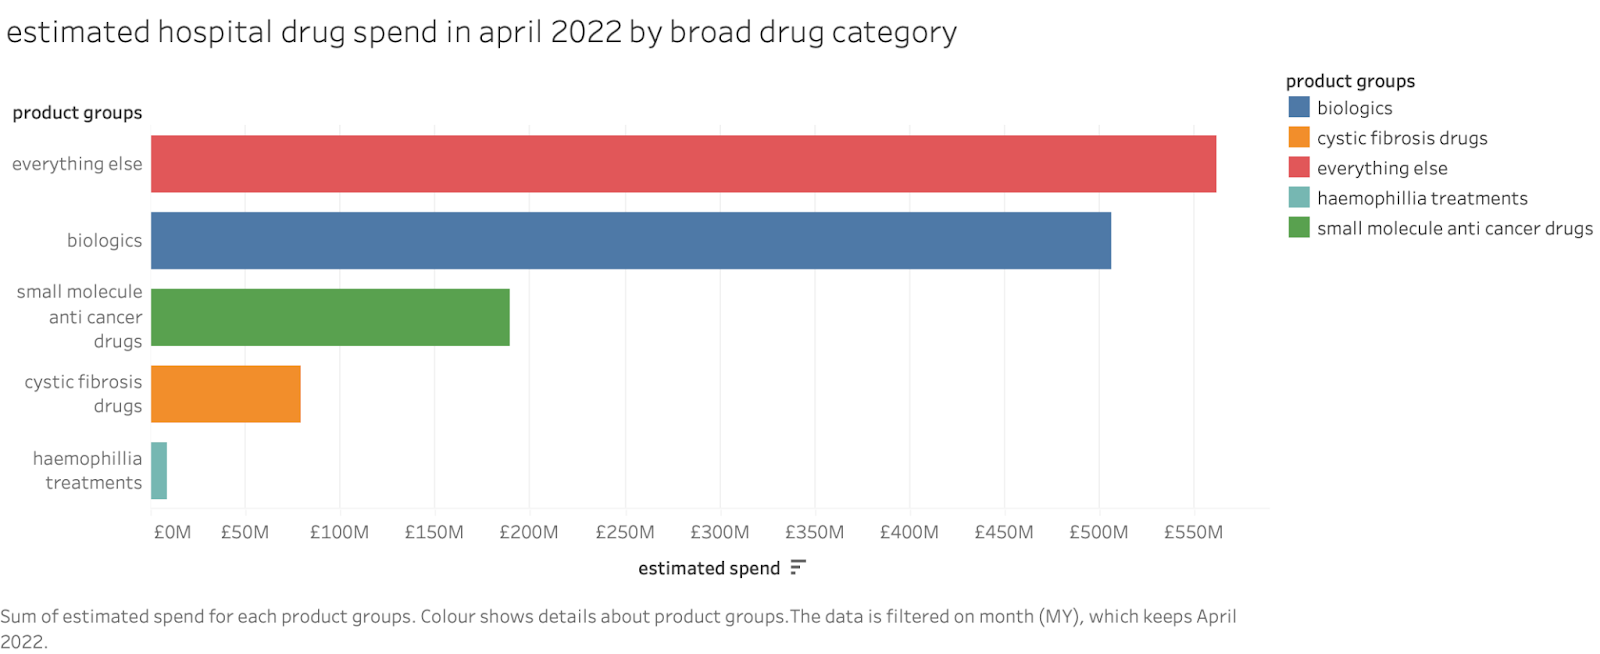
These categories are probably imperfect as I have to group drugs by name and manually but it is probably not too far out as there are not many big cost drugs and they can be checked by hand.
There are only about 39 drugs with spend above £100m a year. These are shown below:

The list is dominated by modern biologics (all monoclonal antibodies) which are used in autoimmune diseases and cancer, small molecule anticancer drugs and the new category of cystic fibrosis treatments.
How have those new categories grown over time? This is shown below:

Over just that 3 year period the annual rate of growth for anti-cancer small molecular drugs was ~20%/yr and biologics grew at ~13%/yr with the everything else group at about 6%/yr. The rapid growth rates of biologics (many of which are anticancer therapies) and anti cancer drugs is very notable. We can't tell this for sure with this small time period, but it is likely that these are a major contributor to the rapid growth of the headline spend shown in the NHS Digital annual totals since 2010.
The data also contains information about which hospitals used the drugs. Without a lot of extra analysis, I can't be confident that practice in use of these drugs is consistent. It seems likely, though, that it practices varies widely as the top spender in april spent over £50m but there were 63 hospital trusts (out of nearly 200) that spent <£1m.
It seems likely to me that, if we could manipulate and analyze this data as well as primary care data, we could spot large variations in practice and drive some more convergence around what constitutes good value for money.
So what?
The first lesson here should be that it is important for the NHS to know where its budget is being spent and what it is being spent on. This budget has had very little public scrutiny.
In an area of spend with such rapid growth it is vital that we know the money is being spent well. Hospital spend on drugs seems to have grown from perhaps 3-4% of the total NHS budget in 2010 to more than 10% in 2022. Even if you argue that the indicative spend above is misleading as hospital pharmacy teams negotiate big discounts over the indicative price, the rate of growth in spend is extremely worrying. At this growth rate, even if the total is overstated by 30% because of discounts, it will reach the totals quoted above within 2 years. And without adequate analysis or control it will keep growing at the same rate consuming more and more of the NHS budget without any confirmation that we are getting the vastly improved outcomes we would expect.
On the topic of discounts, some hospital pharmacists told me they were, in fact, saving the NHS large amounts by negotiating big discounts and should be credited for the several billions of savings from those. But that misses the point that the total spend is rising rapidly, despite their claimed savings. Besides, they could claim that the NHS is saving £5bn/yr on Humira (adalimumab, the biggest drug in the hospital budget) because the NHS pays only 10% of the US price. But these numbers are about as meaningful as the "savings" during a DFS sofa sale.
Another comment from insiders was that this vast growth in spend is policy. "We have to use those expensive new drugs because NICE says so." Or because whatever the cancer drugs fund (or whatever it is called now) says. But NICE doesn't say to give new drugs to every patient. Hospitals still have to judge whether the incremental improvement in QALYs is worth it beyond providing false hope to sick patients. And this is hard to judge without the ability to combine drug usage data with outcomes and to benchmark practice across multiple hospitals which historic versions of this data have made almost impossible and even the recent releases don't make easy. And many of the new cancer drugs are not major breakthroughs that cure cancer, but incremental improvements that add just a year or two to "progression free survival".
Since 2010 the NHS budget has grown by perhaps 3% a year. The hospital drug budget has grown by about 14% a year and that rate appears to be increasing. What else did the NHS stop doing to free up that money? Much of the money comes from the specialized commissioning budget, but that is legendarily the most out of control in the whole NHS so it isn't clear that anyone knows.
Where are the big improvements in cancer outcomes? How many QALYs has an increase in the annual budget of >£10bn/yr since 2010 bought the NHS?
To put this in perspective, it costs the NHS about £9bn a year to run GP practices and they dispense about £9bn a year of drugs. The hospital drug budget is estimated to be bigger than both combined in 2022. Adding about 15% more to the GP budget (roughly the cost of the long stated target to add 6k more GPs) would cost about maybe £1.5bn. Many estimates suggest this would improve the quality and outcomes of care in the NHS by a large margin (probably decreasing mortality by notable amounts according to an old estimate). That is less money than the annual increase in the hospital drug budget.
To put this another way, we have no idea whether the NHS could have improved the health of the whole english population by a much larger amount had it chosen to spend this money on something else. The lack of attention to this huge budget and the lack of detail about what it has bought the NHS in outcomes is a huge problem that deserves far more attention.
Conclusion
The rapidly increasing NHS spend on expensive hospital drugs seems to have gone almost unnoticed even though it must be displacing other–potentially more useful–areas of activity. NHS leaders have recently, for example, called for a clamp-down on GP overprescribing despite this being a tiny problem in comparison and one that is getting smaller every year not least because of the well curated detailed, public data about primary care prescribing.
The NHS needs to pay more attention to hospital prescribing. It should be spending serious effort in several areas:
Fix the obvious errors in the data
Spend the effort to create a coherent hierarchical classification of the drugs to facilitate coherent analysis
Map the spend and volume data to clinical outcomes to make it easier to judge the benefits
Start including reliable data on the actual (not indicative) spend (which might require radical approaches to commercial confidentiality)
If it doesn't do this the risk is that this spend will continue to consume an increasing proportion of the NHS budget with no assurance that it is improving outcomes. Never mind improving outcomes more effectively than spending the same budget elsewhere.
Probably worth remembering the Cancer Drugs Fund was literally pitched to David Cameron by Roche lobbyists.
ReplyDelete