A recent newspaper story highlighted large price increases for some generic drugs prescribed by the NHS. I was able to replicate the information in the story and explore other issues with drug pricing in a single afternoon. Here I describe how I did it. There are valuable lessons here for anyone who needs to get rapid analysis from large datasets.
Two stories in The Times (the original story, the follow up) claimed that the NHS was losing £260m a year due to extortionate pricing of some generic drugs, some of which had seen price increases of > 1,000% as their licence holders exploited a loophole in the pricing rules. I wanted to check their facts and investigate price changes in all the drugs prescribed by the NHS.
This blog is (mostly) about how I did that and I'm telling it because the lessons about how get rapid answers from large datasets are very useful in healthcare. But the NHS tends to use its vast repositories of data badly and is slow to adopt technologies to make the task of searching for insights faster and easier. What I did to validate the stories from The Times shows that, if you use the right technology for storing and querying the data, you can get almost instant insight whenever a new question arises.
The data source
The reason the question can be answered is that the HSCIC NHS Digital has been releasing the data about all prescriptions issued in England every month since August 2010 (you can find the latest month here). This data describes every prescription (not just the drug but the specific formulation) dispensed in primary care, which GP practice or clinic prescribed it and how much the NHS paid for it.
It is a large data source. Each month the raw data has about 10m rows of data in a single CSV file of about 1.5 GB. The full dataset is about 700m rows of data and takes nearly 100 GB of space to store. This summarises about 5 billion individual prescriptions. Even a single month is too large for convenient analysis by spreadsheet and the full dataset is too large to fit easily on a laptop hard drive unless you have a very powerful laptop and don't want to do much else with it. In my case it was prescribing data or several editions of Football Manager: no contest.
But the raw data isn't enough for useful analysis. Individual items (which can be drugs or a range of devices or equipment) are coded using only a 15 character BNF Code which describes the item uniquely but doesn't give much information about what it is (for example what the key active ingredient is). Prescribers are coded by a unique code that doesn't tell who they are or where they are. Some of this information is released alongside the data: a mapping of prescribers to their address is provided as is a mapping of the BNF Codes to the key ingredient.
But for convenient analysis we need to group the items together in a hierarchical way. The BNF (the British National Formulary) does this by assigning each item to a chapter, a section and paragraph/subparagraph which groups things together into meaningful categories. For example, the Cardiovascular System constitutes a chapter, Diuretic drugs a section and different types of diuretics are grouped together in paragraphs (with similar groupings for other cardiovascular drugs).
Unfortunately, the HSCIC doesn't provide an up to date list of the BNF categories. The Business Services Agency, which collects this data as a side effect of the process for paying pharmacists to dispense the drugs, does but it is in an obscure place (see instructions here) and it isn't kept rigorously up to date (so every month you need to do some manual editing when new drugs are launched and, when the BNF reorganises the hierarchy, even more work is required to tweak the mappings between old codes and the new structure). Luckily, I've been keeping my data up to date.
Storing and managing large data sources
I've been keeping an up-to-date copy of the prescribing data since I was involved in developing a tool to help medicne managers exploit it several years ago. While building that tool I explored several ways to help store and manage the data and several tools to make it easy to analyse. The combination I ended up with is Google's BigQuery and Tableau. BigQuery is a cloud data warehouse optimised for fast queries on large datasets. Tableau is a desktop visual analytics tool that works well alongside BigQuery (or most other databases).
What is particularly fantastic about BigQuery is that it allows superb analytics query speed for no upfront investment. To achieve similar speeds on in-house systems you would have to spend tens of thousands on hardware and software: BigQuery give you almost interactive analytics performance as soon as you have loaded the data. And you only pay for storage and the volume of data returned by queries, neither of which are expensive. No database tweaking or maintenance are required. And, if you drive you analytics from Tableau, you don't even have to write any SQL to get results: it is all driven by visual actions inside Tableau.
In fact the hardest and most time consuming parts of the process of managing the prescribing data is maintaining the metadata which requires sourcing and manipulation of data from a variety of other sources.
Some basics about the dataset using Tableau
My core data and metadata are already stored in BigQuery so all I need to do to analyse it is to connect Tableau to the data sources and define the relationships between the core data table and the metadata tables. Tableau has a neat visual window for defining these relationships. The only other steps required for interactive analysis is to define some additional calculations for convenience. This is as easy as writing formulae in a spreadsheet. In this case I had to convert the dates in the data source (YYYYMM format) into dates Tableau can understand via simple string manipulation and I had to define some new formulae to calculate things like the average cost per prescription.
The hardest part of doing the analysis relevant to drug prices was remembering how to calculate changes in price from a fixed date in Tableau (it is easy: see here for a guide to doing it).
Once Tableau is plugged into BigQuery and those additional calculations are set up, everything else is a matter of a few minutes away. Query results from BigQuery can take ~30s on a bad day and Tableau will return tables or charts straight away which can all be modified or adjusted visually without the user needing to go to SQL or some other query language. The interactive and visual approach used by Tableau allows the user to focus on getting the right question, the right analysis and the right presentation of the data.
The analyses
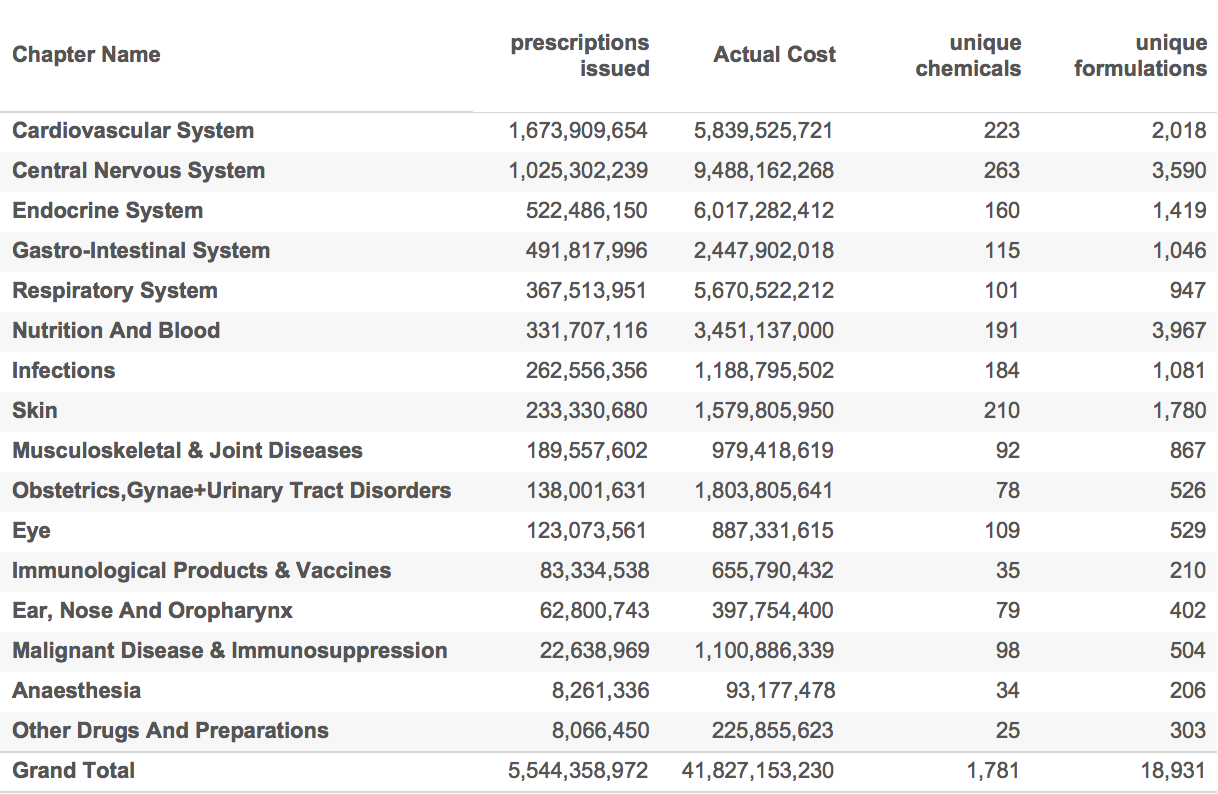
The table below, for example, took a couple of minutes to generate even though it summarises all of the drugs issued since 2010 in several different ways (part of the process was to summarise everything and then eliminate the devices and dressings categories).
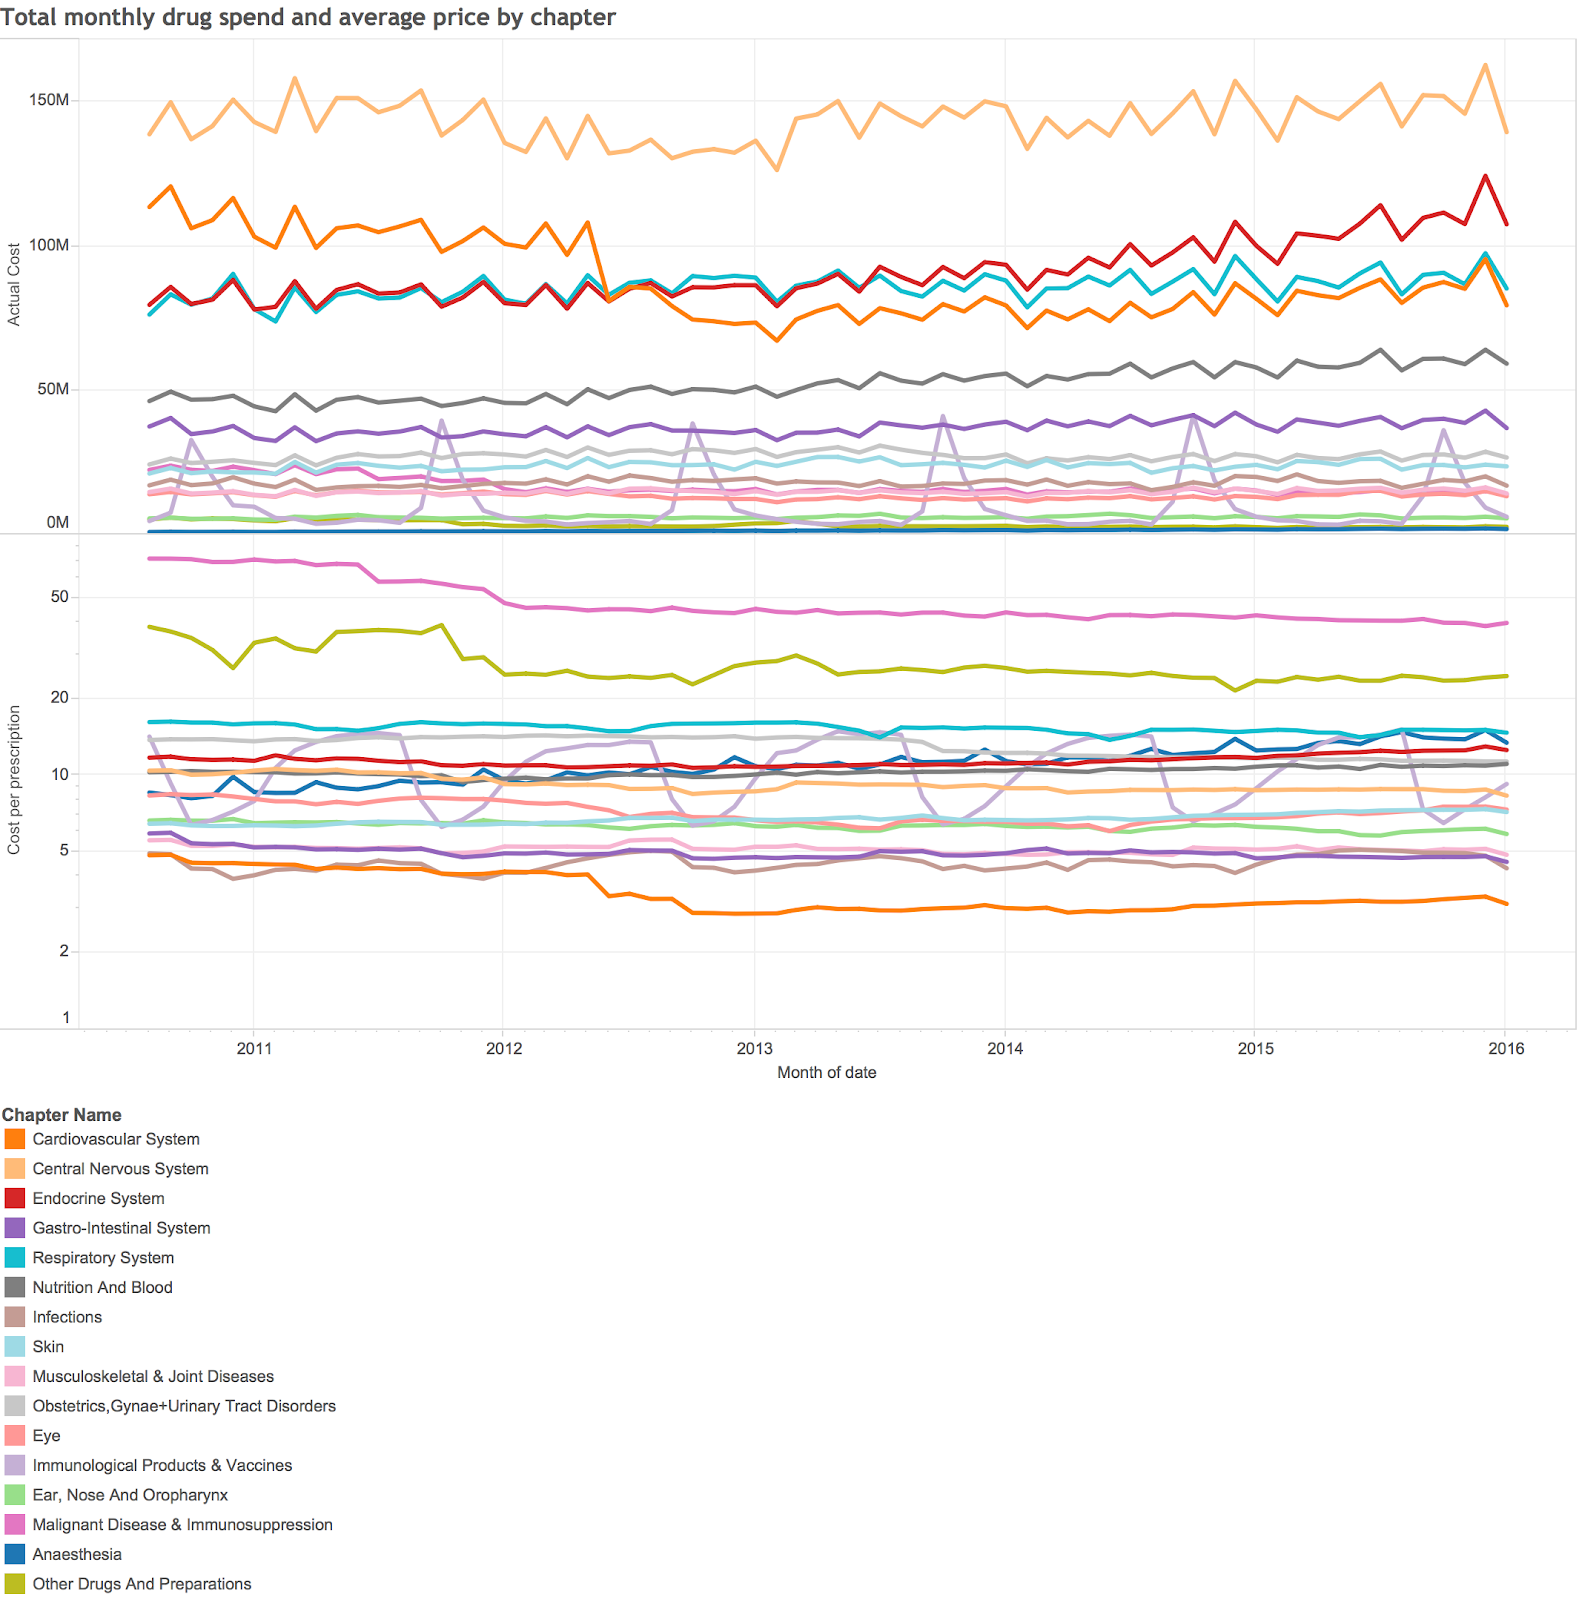
It is easy to create visual analysis as well as tables. This summary of monthly spend and prices took a few more minutes to generate:
This is very high level summary analysis, but Tableau makes it easy to drill down to the lowest levels of detail available. For addressing the question posed by the stories in the times I needed to look at the changes in prices of individual drugs (or chemicals) over time.
It is easy to set up the analysis. I just had to create a table showing the volume and average price of all chemicals by date (this is a big table as there are nearly 2,000 unique chemicals though not all the ones in 2016 were also used in 2011). I sorted the table and selected all the examples where the price was more than 400% higher in january 2016 than it was in january 2011 (my threshold is slightly different than the times). Then I grouped the low volume examples together and got this table:
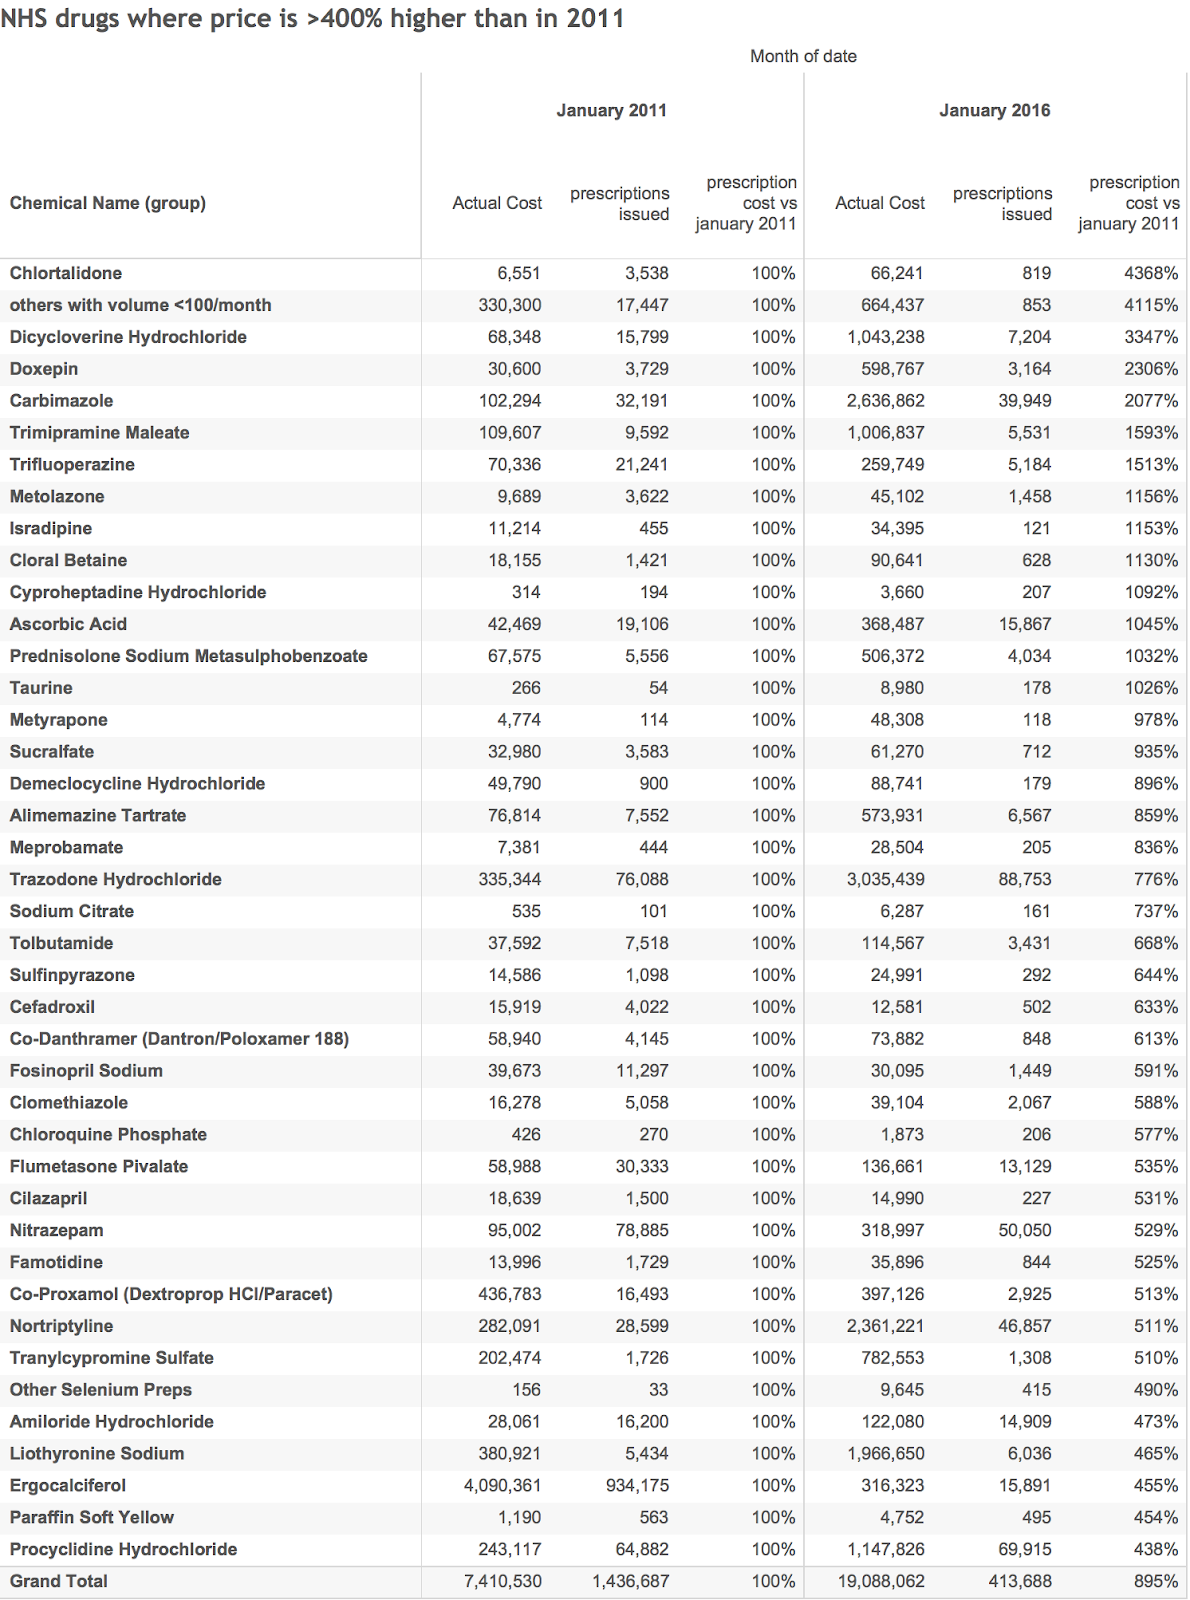
This gives a good general overview of the places to look for big price hikes.
We can also do specific analysis of individual chemicals. The times mentioned 4 in particular. Their volume and price history is shown in the chart below.
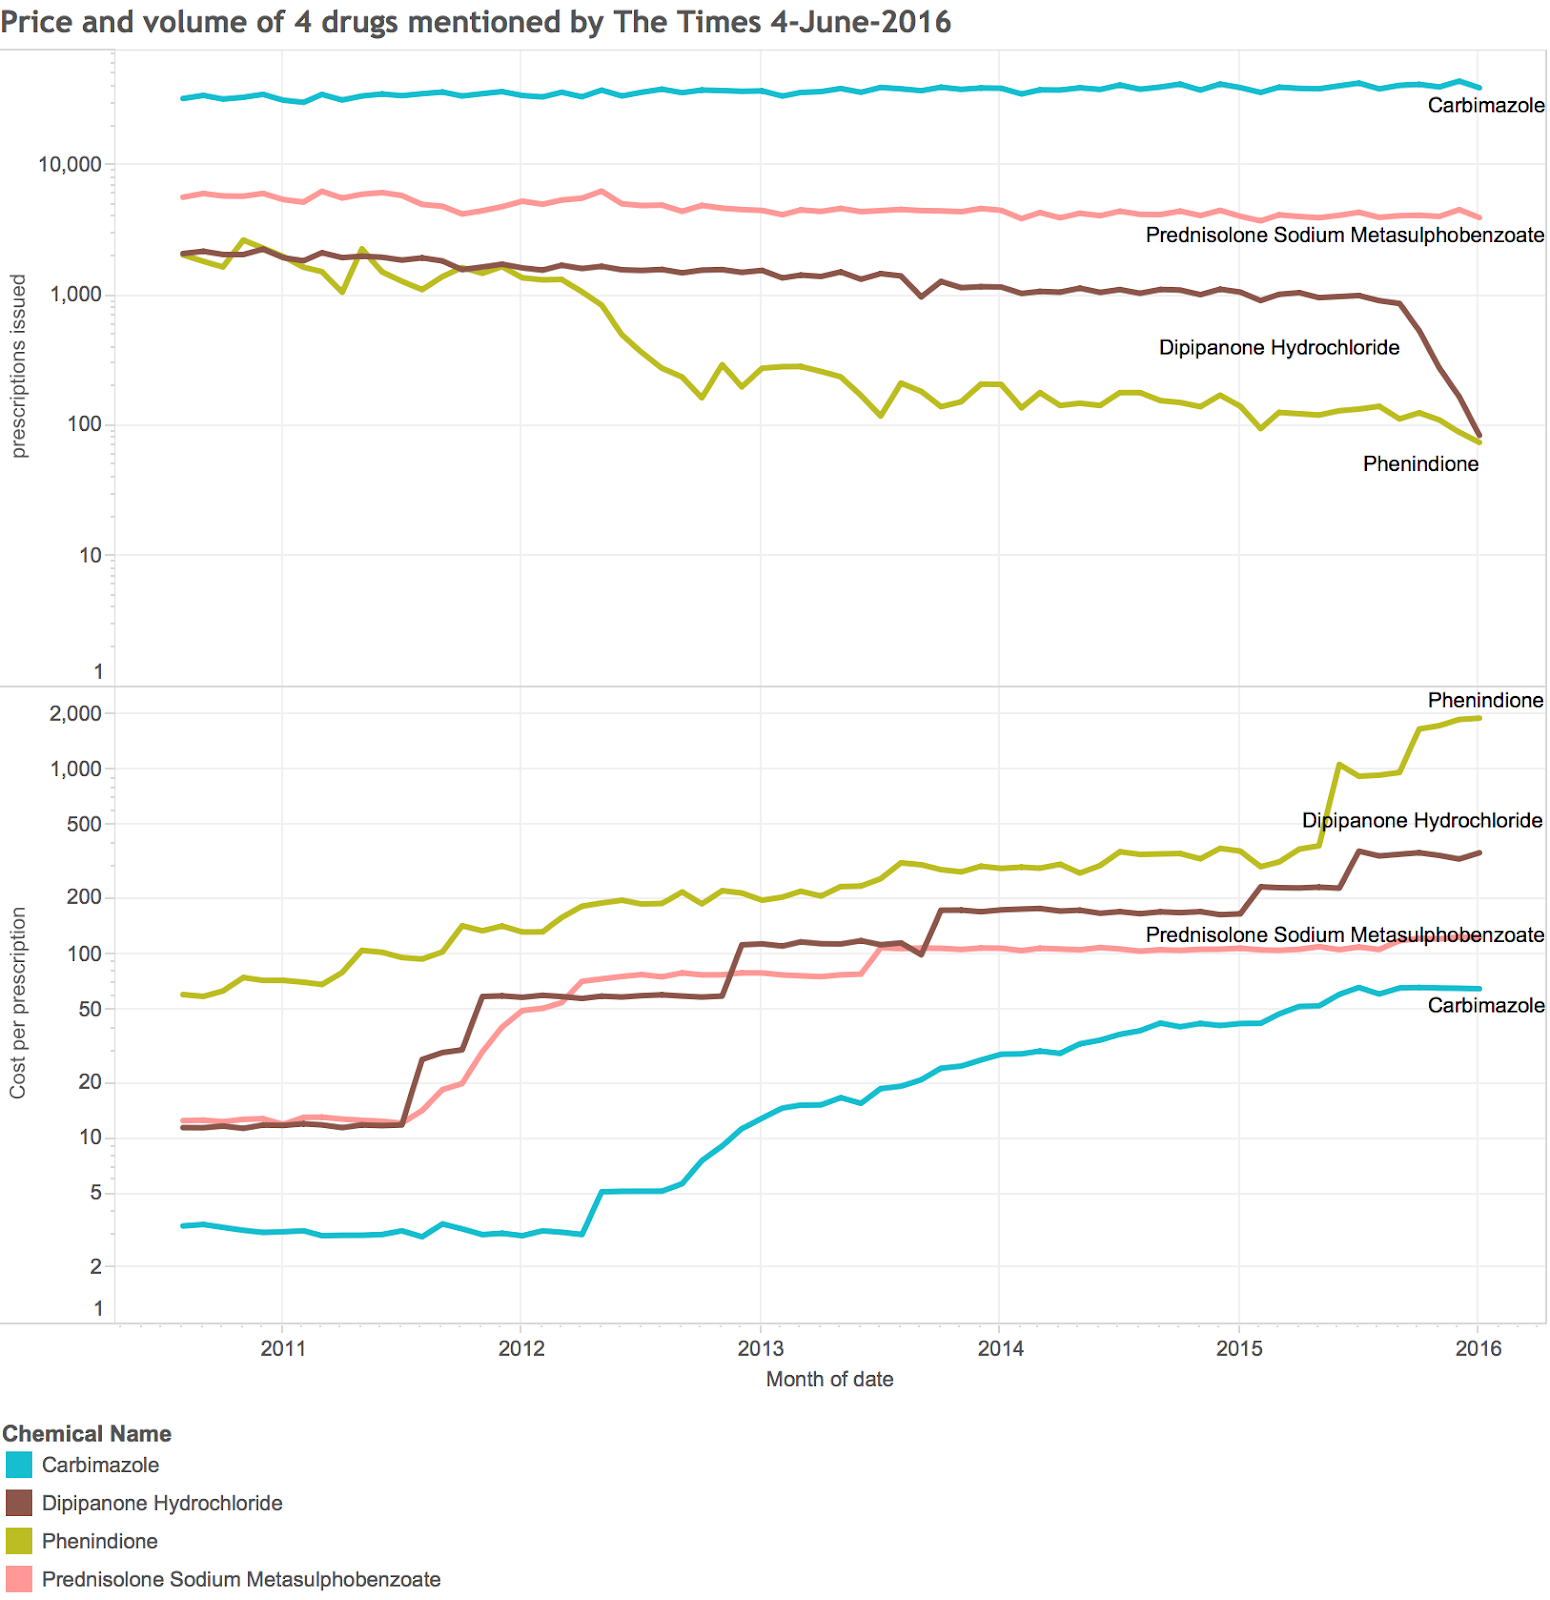
Again, this took only a few minutes to generate. Note the log scales used to fit the enormous price increases into a scale you can read.
Of course, we can also do ad-hoc analysis of things that the Times Didn't ask, like which drugs have seen the biggest price decreases because of the benefits of generic competition. That table is below:
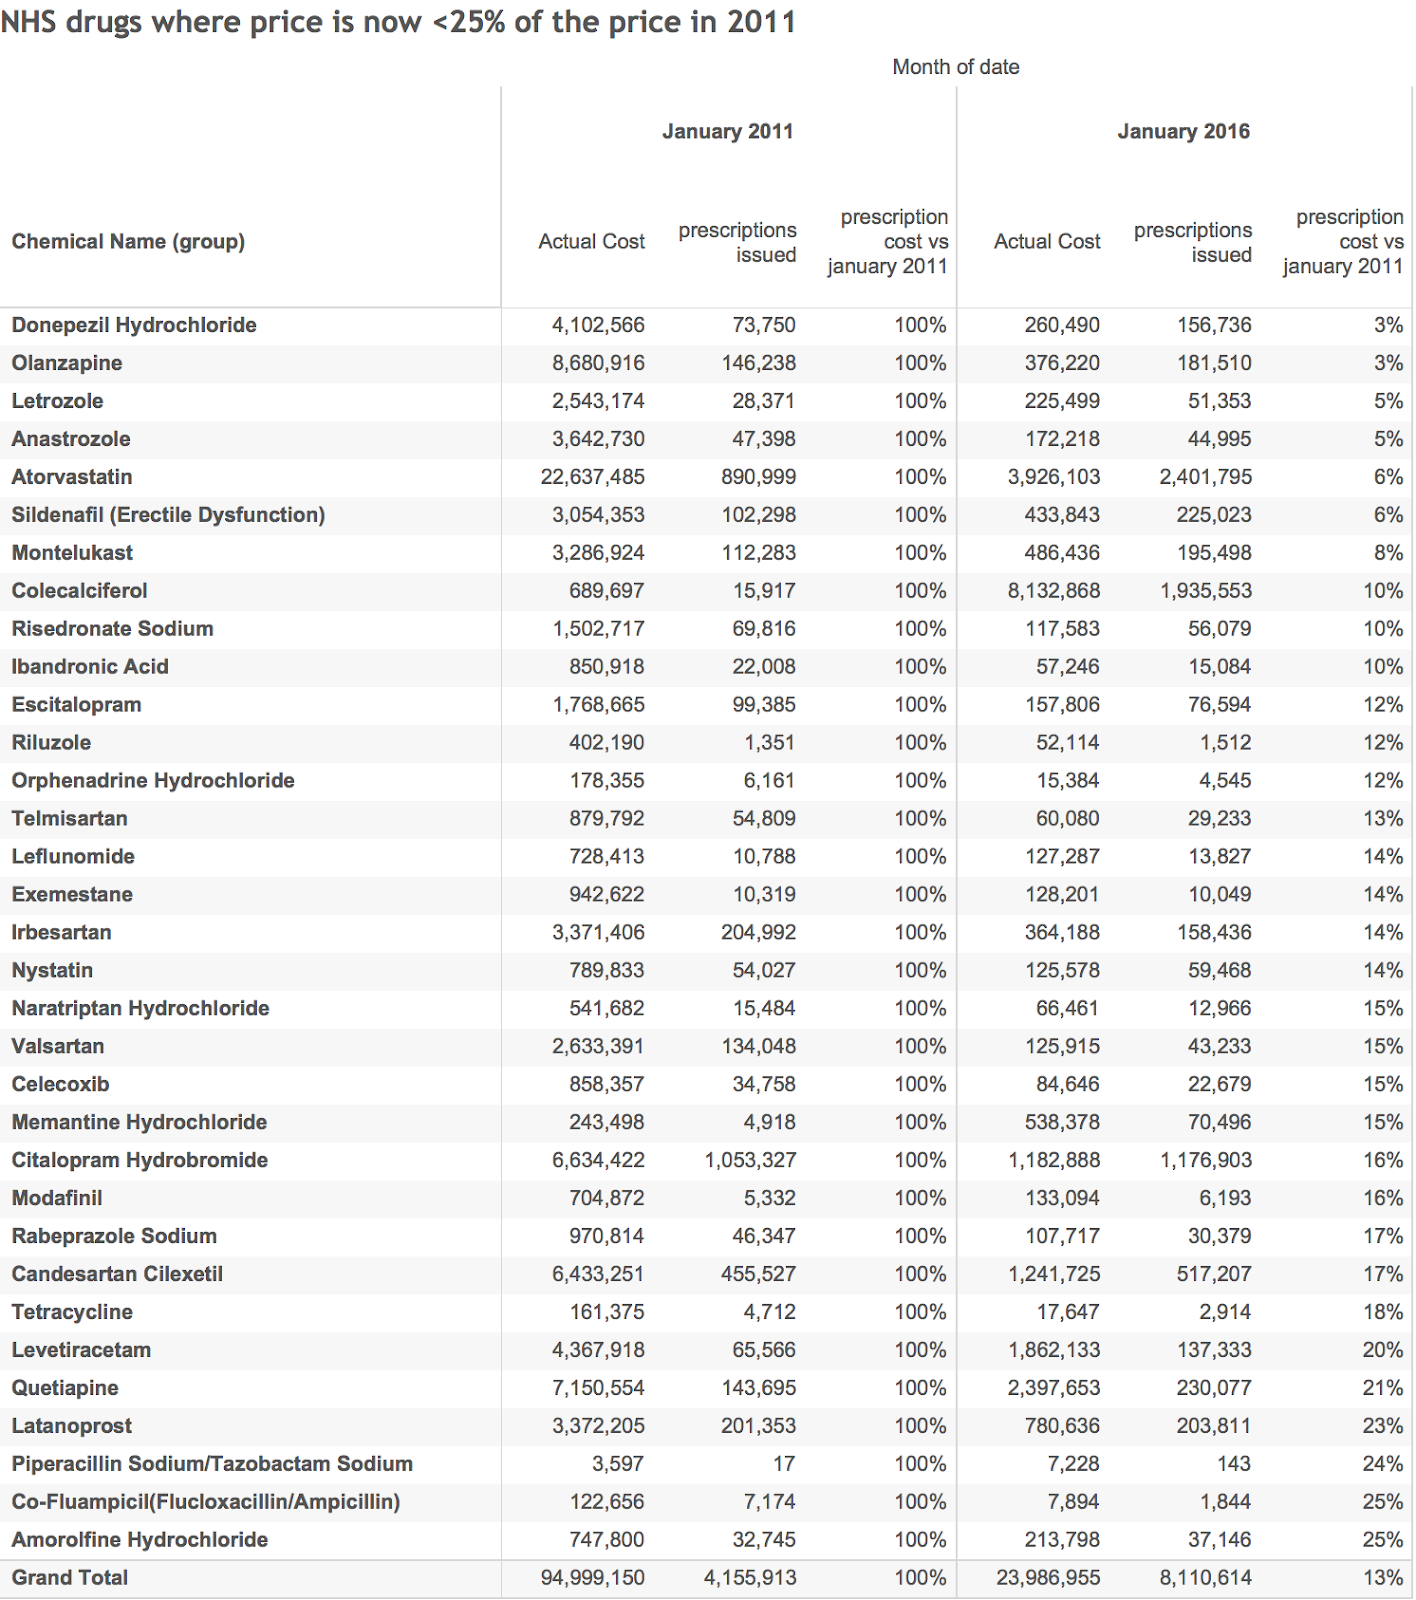
The NHS is saving >£70m every month for this list alone (and if we took rising volume into account the savings would be even bigger).
If you pick the right tools for analysing big data, you can spend time focussing on the questions
It took me an afternoon to replicate the Times analysis and to go much further. Admittedly, I already had the data and platform for analysing it. But this is much faster than can be achieved by any tool provided by the NHS. This is strange because a number of key NHS improvements depend on good analysis of this dataset. The Times highlighted where it is useful in controlling spending by highlighting excessive pricing based monopolistic positions from suppliers. But the same data can highlight who prescribes too many antibiotics, those who don't give their patients the right mix of diabetes medication or where modern alternatives to warfarin are being used.
Making the data easy to work with is an essential part of making it useful. Platforms that allow rapid answers to be derived from the complete dataset are far better than tools that allow only local or partial analysis. Many smart people are currently wasting weeks of their valuable time wrangling parts of this dataset to answer smaller, less useful questions. They should be applying their brains to bigger questions and the NHS should be giving them the tools to make them more productive.
This isn't happening. Ben Goldacre, for example, struggled to get NHS funding for an online tool that allows this sort of analysis to be done by anyone (this now exists in beta form but has mostly be funded by charities not the NHS).
And the NHS has many other large datasets it needs to make use of. Patient level data for outpatient, A&E and inpatient activity all exist but are significantly underused, partially because finding interesting patterns is hard and slow.
But the world of data analytics has changed in the last five years. The tools exist to take the time and the drudgery out of big data analyses. The NHS should be using them.
Hi Matt! This is an awesome post. I'm looking for contact details, but I can't find a contact address. Would you like to contact me to talk about sharing this data? Thanks!
ReplyDelete(fhoffa at the google)
Analogica Data is one of the Top Big Data Analysis Company in India.provides services like Dashboarding and Visualisation,Big Data Analysis,Internet Of Things,Data Warehousing,Data Mining and Machine Learning.
ReplyDeleteAnalogica Data is one of the Top Big Data Analysis Company in India.provides services like Dashboarding and Visualisation,Big Data Analysis,Internet Of Things,Data Warehousing,Data Mining and Machine Learning.
Hello Matt,
ReplyDeleteThe Article on Ad hoc analysis of big data sources is very informative give detail information about it. Thanks for Sharing the information about Data Science big data scientist